 Global| Feb 15 2007
Industrial Production Falls Unexpectedly by 0.5% in January
Summary
Total U.S. industrial production decreased by 0.5% last month. Revisions to December and November data were mixed, pushing the December total up to a 0.5% gain from 0.4% reported before and holding November at the -0.1% change [...]
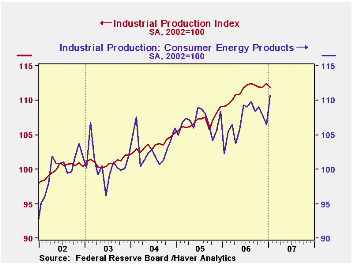
Total U.S. industrial production decreased by 0.5% last month. Revisions to December and November data were mixed, pushing the December total up to a 0.5% gain from 0.4% reported before and holding November at the -0.1% change previously published. Consensus expectations had called for a January production figure unchanged from December rise.
Factory sector output dropped 0.8% after December's upwardly revised 1.0% gain. November, however, was shaved further to -0.1% from an originally reported 0.3% increase.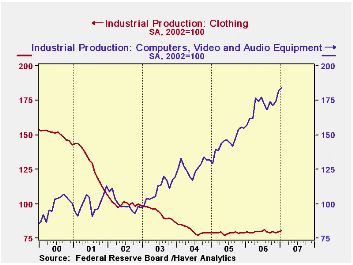
Mining industry output declined 1.2% after a 1.5% increase in December. Utilities, by contrast, saw their output gain 2.3%; temperatures around the country returned to more normal levels after a mild December, so utility output became more seasonal following weakness in November and December. Remarkably, the utility sector has seen production unchanged on balance over the past six months (seasonally adjusted).
Among manufactured products, consumer durables output dropped 2.4%, erasing much of the November and December gain. The automotive sector was largely responsible, losing 4.4%. Among other groups, only computers and video equipment managed an increase.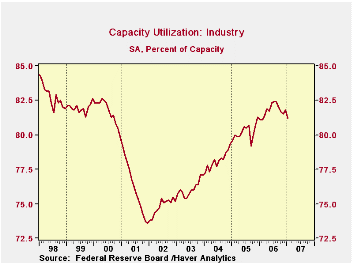
Consumer nondurable goods fell 0.6%; their December decrease was revised from 0.2% to 0.4%, but November's was ameliorated slightly from -0.4% to -0.2%. Food and chemical products both fell, while paper and clothing increased. After two monthly declines totaling 2.3%, energy production rebounded 3.9%. In our second graph here, we call your attention to two trends: the well-known continuing gains in computers and other home electronics and also a perhaps less-noticed stabilization of clothing output. This latter fell from about 185 (2002=100) at the beginning of 1995 to a range of 77 to 80 in late 2004 through 2006. The textile industry as a whole continues to contract, but clothing itself is maintaining its rate of production, albeit at a low level.
Business equipment production, with a drop of 1.7%, gave up half of its November/December increase. Transportation and industrial shared in the decline, while information processing equipment rose 0.9%, a fifth consecutive monthly gain.
With the decline in total output, total industry capacity utilization fell back in January, reaching 81.2% after 81.8% in December, which was unrevised. It has been trending lower now an August peak, and has returned to its level of February 2006. In manufacturing, utilization went down from 80.2% in December to 79.4% in January, the lowest since a similar rate in November 2005.
| Production & Capacity | Jan 2007 | Dec 2006 | Nov 2006 | Y/Y | 2006 | 2005 | 2004 |
|---|---|---|---|---|---|---|---|
| Industrial Production | -0.5% | 0.5% | -0.1% | 2.6% | 4.1% | 3.2% | 2.5% |
| Manufacturing (NAICS) | -0.8% | 1.0% | -0.1% | 1.9% | 5.0% | 4.0% | 3.0% |
| Consumer Goods | -0.2% | 0.1% | 0.3% | 1.7% | 1.3% | 2.8% | 1.4% |
| Business Equipment | -1.7% | 2.3% | 0.7% | 8.7% | 11.7% | 7.9% | 4.3% |
| Capacity Utilization | 81.2% | 81.8% | 81.5% | 81.1% (01/06) | 81.8% | 80.2% | 78.1% |
by Carol Stone February 15, 2007
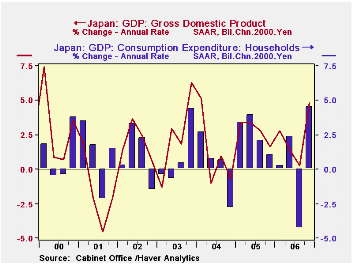
Japan's GDP surged upward 4.84% in Q4 at an annual rate, the Cabinet Office reported early today in Tokyo. Forecasters had looked for 3.8-3.9% growth, according to news service surveys. It was the largest quarterly gain since Q1 2004 at 5.11%.
Domestic final demand was responsible for the strong rise. Consumer spending, which had fallen 4.3% in Q3, rebounded nicely by 4.5% in Q4. Private investment expenditures in plant and equipment grew at a 9.2% rate, following a much more modest 3.4% in Q3. The year's total nonresidential investment grew 7.3%, the fourth consecutive good gain in real investment outlays and the largest since 2000's tech boom.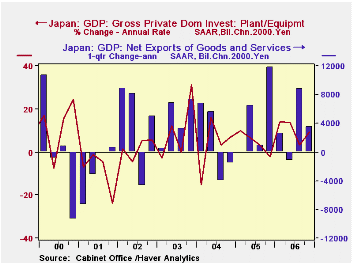
Other major components slowed: the change in private inventories was ¥1.15 trillion, less than Q3's ¥1.85 trillion. Exports grew at a 4.3% annual rate, easing from the 10.0% pace in Q3. Imports fell by a marginal 0.1% after a 1.8% annualized decline in Q3. The resulting net export figure, ¥21.84 trillion, was up just ¥883 billion, well less than half Q3's ¥2.20 trillion increase.
This broad-based gain in Q4 GDP growth in Japan has analysts talking in the press today about BoJ interest rate hikes, soon. Possibly, but we can't help notice interesting downward revisions in the Q3 data. Three months ago here, Louise Curley described the then surprisingly large 2.03% rate of increase in Q3 GDP. Interim revisions put that figure down at 0.84% (still carried in Haver's OECDNAQ database and several forecast databases) and today's report has shaved it further to just 0.26%. The same pattern is evident in the household consumption component: an original report of a 2.98% rate of decline in Q3 became -3.80% and now -4.29%. So, yes, the Q4 report looks good now, but we hope it has staying power! The "Second Preliminary" GDP report will be issued by Japan's Cabinet Office on March 12. Stay tuned.
| Japan: SAAR % Chg | Q4 2006 | Q3 2006 | Q2 2006 | Q1 2006 | Q4 2005 | 2006 | 2005 | 2004 |
|---|---|---|---|---|---|---|---|---|
| Real GDP | 4.84 | 0.26 | 1.35 | 2.81 | 1.65 | 2.16 | 1.87 | 2.72 |
| Feb 8 OECD* | -- | 0.84 | 1.14 | 2.71 | 2.06 | -- | 1.88 | 2.72 |
| Nov 14* | -- | 2.03 | 1.51 | 3.17 | 4.09 | -- | 2.69 | 2.13 |
| Consumption | 4.50 | -4.29 | 2.41 | 0.27 | 1.06 | 0.94 | 1.49 | 1.55 |
| Feb 8 OECD* | -- | -3.80 | 2.11 | -0.19 | 1.88 | -- | 1.51 | 1.55 |
| Private Nonresidential Investment | 9.22 | 3.41 | 13.66 | 14.03 | -2.11 | 7.32 | 6.61 | 5.43 |
| Private Inven- tories (Bil.¥) | 1155.5 | 1845.5 | 741.1 | 1639.1 | 660.4 | 1345.3 | 1033.4 | 1815.8 |
| Exports | 4.30 | 10.01 | 2.77 | 9.65 | 15.77 | 9.72 | 6.94 | 13.98 |
| Imports | -0.13 | -1.79 | 5.69 | 8.12 | -1.23 | 4.63 | 5.85 | 8.11 |
Carol Stone, CBE
AuthorMore in Author Profile »Carol Stone, CBE came to Haver Analytics in 2003 following more than 35 years as a financial market economist at major Wall Street financial institutions, most especially Merrill Lynch and Nomura Securities. She had broad experience in analysis and forecasting of flow-of-funds accounts, the federal budget and Federal Reserve operations. At Nomura Securities, among other duties, she developed various indicator forecasting tools and edited a daily global publication produced in London and New York for readers in Tokyo. At Haver Analytics, Carol was a member of the Research Department, aiding database managers with research and documentation efforts, as well as posting commentary on select economic reports. In addition, she conducted Ways-of-the-World, a blog on economic issues for an Episcopal-Church-affiliated website, The Geranium Farm. During her career, Carol served as an officer of the Money Marketeers and the Downtown Economists Club. She had a PhD from NYU's Stern School of Business. She lived in Brooklyn, New York, and had a weekend home on Long Island.
More Economy in Brief
 Global| Feb 05 2026
Charts of the Week: Balanced Policy, Resilient Data and AI Narratives
by:Andrew Cates


