 Global| Aug 08 2006
Industrial Production Falters in Germany: Forges Ahead in Turkey, Hungary and Slovakia
Summary
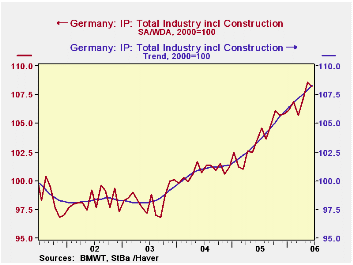
Contrary to expectations, industrial production in Germany fell 0.4% to 108.2 (2000=100) in June from 108.6 in May. While there is reason to believe that high oil prices and the strength of the euro will eventually, slow world demand [...]

Contrary to expectations, industrial production in Germany fell 0.4% to 108.2 (2000=100) in June from 108.6 in May. While there is reason to believe that high oil prices and the strength of the euro will eventually, slow world demand for German goods and hence, production, the decline in production in June has not been large enough to change the underlying positive trend. The trend in production computed and published by the German Statistical Office is shown in the first chart together with the seasonally and working day adjusted data. The trend value for June is 108.3, compared with 107.9 for May.
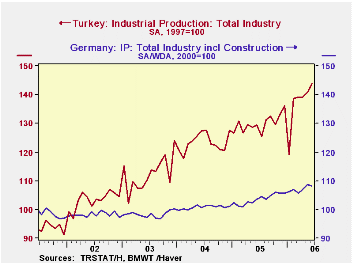
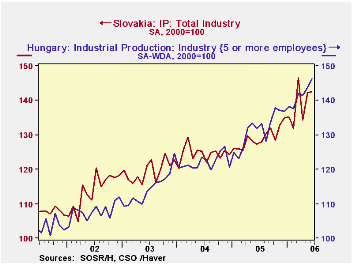
In the emerging countries, Hungary, Slovakia and Turkey, industrial production continues to forge ahead. Production in Slovakia was up 0.21% in June from May, in Hungary, 1.78% and in Turkey, 2.20%. In all three countries, industrial production in June averaged 10-12% above June, 2005 in contrast with Germany's whose year over year growth in production was 4.5%. The contrast between the growth in industrial production in Turkey and in Germany is shown in the second chart and the similarity between the growth in production in Slovakia and Hungary is shown in the third chart.
Indexes only tell us how a particular level of a series varies from a base value. Thus, the 108.2 of industrial production in Germany in June only tells us that production is 8.2% above whatever the average level of production in 2000 was. If we want absolute values that are comparable, we have to look elsewhere. To compare the sizes of these four countries we have chosen to use the GDP expressed in constant prices and constant exchange rates.. For the three emerging countries this value is listed in the National Account Section of each country in terms of 1995 prices and 1995 exchange rate. In the case of Germany, this value is given in the G10 Data Base and is in terms of 2000 prices and exchange rate.
In 2005, the dollar value at constant exchange rates of real GDP in Germany was $1,972 billion; for Turkey, $259 billion; Hungary, $67 billion; and Slovakia, $26 billion. In 2000, the comparable dollar values were $1,904 billion for Germany; Turkey, $210 billion; Hungary, $55 billion; and Slovakia, $20 billion. The percentage changes between 2000 and 2005 were 3.6% for Germany, 23.5% for Turkey, 22.7% for Hungary and 23.2% for Slovakia.
| Industrial Production (2000=100) | Jun 06 | May 06 | Jun 05 | M/M % | Y/Y % | 2005 | 2004 | 2003 |
|---|---|---|---|---|---|---|---|---|
| Germany | 108.2 | 108.6 | 103.5 | -0.37 | 4.54 | 103.7 | 100.8 | 98.4 |
| Trend | 108.3 | 107.9 | 102.3 | 0.37 | 4.84 | 103.6 | 100.9 | 98.5 |
| Slovakia | 142.6 | 142.3 | 127.4 | 0.21 | 11.93 | 129.1 | 124.6 | 119.6 |
| Hungary | 143.1 | 140.6 | 129.5 | 1.78 | 10.50 | 129.9 | 120.9 | 113.3 |
| Turkey * | 139.1 | 136.1 | 125.0 | 2.20 | 11.29 | 125.7 | 119.3 | 108.7 |
More Economy in Brief
 Global| Feb 05 2026
Charts of the Week: Balanced Policy, Resilient Data and AI Narratives
by:Andrew Cates


