 Global| Feb 11 2008
Industrial Production in the Ukraine and Kazakhstan
Summary
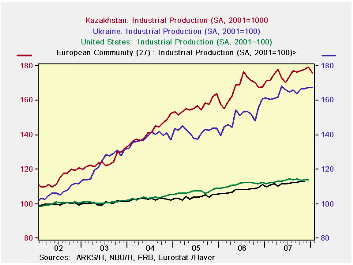
The preliminary data for January 2008 for industrial production in the Ukraine show a minimal increase of 0.06% and that for Kazakhstan, a 2% decline, as can be seen in the first chart. Industrial production in both countries, which [...]

The preliminary data for January 2008 for industrial production in the Ukraine show a minimal increase of 0.06% and that for Kazakhstan, a 2% decline, as can be seen in the first chart. Industrial production in both countries, which has been growing faster than that in the United States and the European Community over the past several years appears to be slowing up, as can be seen in the second chart. (All the data have been indexed to 2001=100 for comparative purposes.)
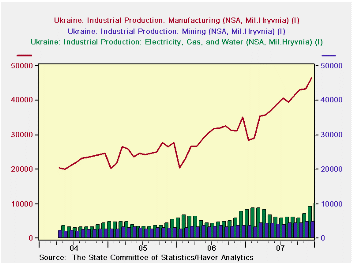
Data are available in the Ukraine for the value of production and its components. Machinery is by far the most important major component, as can be seen in the third chart. Given the value of industrial production it is possible to derive the importance of industrial production in the total economy. In 2006, industrial production accounted for about 7% of Gross Domestic Product, the value of production being 38.364 million Hryvania and Gross Domestic Product , 537,667 million Hryvania (5.05 Hryvania = $1.00).


| INDUSTRIAL
PRODUCTION SA, (2001=100) |
Jan 08 | Dec 07 | Nov 07 | Oct 07 | Sep 07 | 2007 %Chg | 2006 %Chg | 2005 %Chg | 2004 % Chg |
|---|---|---|---|---|---|---|---|---|---|
| Kazakhstan | 175.96 | 179.06 | 178.00 | 177.08 | 176.54 | 5.64 | 6.57 | 10.19 | 13.98 |
| Ukraine Domestic | 167.5 | 167.4 | 166.7 | 166.8 | 164.0 | 9.45 | 5.77 | 12.82 | 11.75 |
| European Community (27) | n.a. | n.a. | 112.77 | 113.32 | 112.36 | n.a. | 3.93 | 1.22 | 2.10 |


