 Global| Jan 27 2005
Initial Claims for Unemployment Insurance Up Slightly
by:Tom Moeller
|in:Economy in Brief
Summary
Initial claims for unemployment insurance rose a slight 7,000 to 325,000 last week. The increase followed the 49,000 plunge the week prior which was slightly greater than reported initially. Consensus expectations had been for a [...]
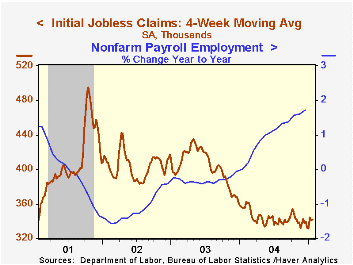
Initial claims for unemployment insurance rose a slight 7,000 to 325,000 last week. The increase followed the 49,000 plunge the week prior which was slightly greater than reported initially. Consensus expectations had been for a larger increase to 330,000 claims.
The four week moving average of initial claims inched back to 341,750 (-3.7% y/y).
During the last ten years there has been a (negative) 82% correlation between the level of initial claims and the y/y change in payroll employment.
Continuing claims for unemployment insurance surged 142,000 w/w and the insured rate of unemployment ticked up to 2.2%.
| Unemployment Insurance (000s) | 01/22/05 | 01/15/05 | Y/Y | 2004 | 2003 | 2002 |
|---|---|---|---|---|---|---|
| Initial Claims | 325 | 318 | -6.3% | 343 | 402 | 404 |
| Continuing Claims | -- | 2,840 | -10.5% | 2,926 | 3,531 | 3,570 |
by Tom Moeller January 27, 2005
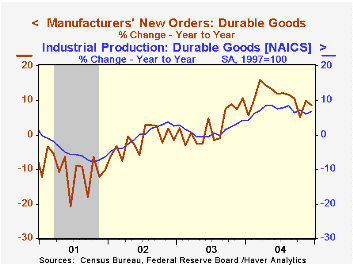
Durable goods orders in December rose 0.6%, right on the Consensus expectation. The advance report of a November surge in orders was little revised. For 2004, the 10.7% gain in orders was the strongest in ten years and led to a 7.1% gain in factory output of durable goods.
Nondefense capital goods orders dropped 1.9%. Aircraft orders fell 16.7% following the 64.7% November spike. Excluding aircraft, orders rose 1.8% but the November gain was halved to 0.9%. For 2004 orders rose 11.5%, the strongest gain since 1997 and led to a 9.5% gain in the industrial output of business equipment, the strongest since 1998.
Orders for computers & electronic products recovered 6.4% (+15.2% y/y) following two months of sharp decline. Machinery orders also rose 3.9% (11.1% y/y) but electrical equipment orders fell 6.1% (+6.2% y/y).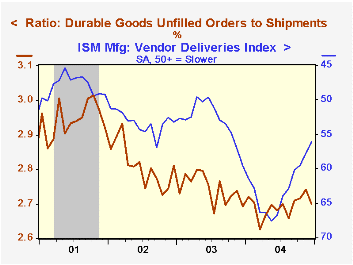
Transportation equipment orders fell 3.0% but less transportation, durable goods orders rose 2.1% (11.9% y/y). Primary metals orders inched 0.3% higher (+28.5% y/y) but orders for fabricated metals fell again (+7.4% y/y).
Unfilled orders rose another 0.5% (9.0% y/y) although shipments surged 2.1% (8.8% y/y). As a result, the ratio of backlogs to shipments fell sharply to the lowest level since August.
Inventories of durable goods dipped slightly (7.4% y/y). Combined with the surge in shipments the decline lowered the I/S ratio to the lowest level since August.
| NAICS Classification | Dec | Nov | Y/Y | 2004 | 2003 | 2002 |
|---|---|---|---|---|---|---|
| Durable Goods Orders | 0.6% | 1.8% | 8.7% | 10.7% | 2.6% | -1.7% |
| Nondefense Capital Goods | -1.9% | 7.5% | 13.6% | 13.5% | 5.6% | -7.2% |
| Excluding Aircraft | 1.8% | 0.9% | 11.3% | 11.5% | 6.6% | -7.1% |
by Tom Moeller January 27, 2005
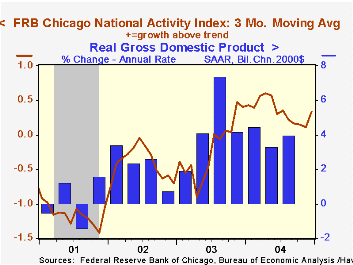
The National Activity Index (CFNAI) compiled by the Federal Reserve Bank of Chicago recovered to 0.39 last month from a downwardly revised 0.05 in November.A zero value of the CFNAI indicates that the economy is expanding at its historical trend rate of growth.
The recovery raised the three-month moving average of the CFNAI to 0.33, its highest level since July.
The CFNAI is a weighted average of 85 indicators of economic activity. The indicators reflect activity in the following categories: production and income, the labor market, personal consumption and housing, manufacturing and trade sales, and inventories & orders.
During the last twenty years there has been a 74% correlation between the level of the CFNAI and q/q growth in real GDP.
The latest CFNAI report is available here.
| Chicago Fed | Dec | Nov | Dec '03 | 2004 | 2003 | 2002 |
|---|---|---|---|---|---|---|
| CFNAI | 0.39 | 0.05 | 0.20 | 0.34 | -0.11 | -0.40 |

Tom Moeller
AuthorMore in Author Profile »Prior to joining Haver Analytics in 2000, Mr. Moeller worked as the Economist at Chancellor Capital Management from 1985 to 1999. There, he developed comprehensive economic forecasts and interpreted economic data for equity and fixed income portfolio managers. Also at Chancellor, Mr. Moeller worked as an equity analyst and was responsible for researching and rating companies in the economically sensitive automobile and housing industries for investment in Chancellor’s equity portfolio. Prior to joining Chancellor, Mr. Moeller was an Economist at Citibank from 1979 to 1984. He also analyzed pricing behavior in the metals industry for the Council on Wage and Price Stability in Washington, D.C. In 1999, Mr. Moeller received the award for most accurate forecast from the Forecasters' Club of New York. From 1990 to 1992 he was President of the New York Association for Business Economists. Mr. Moeller earned an M.B.A. in Finance from Fordham University, where he graduated in 1987. He holds a Bachelor of Arts in Economics from George Washington University.
More Economy in Brief


