 Global| May 18 2006
Initial Jobless Insurance Claims Surge
by:Tom Moeller
|in:Economy in Brief
Summary
Initial unemployment insurance claims surged 42,000 last week to 367,000 due to a partial government shutdown in Puerto Rico. The shutdown added 46,000 claims and has been resolved. Consensus expectations had been for 316,000 claims. [...]
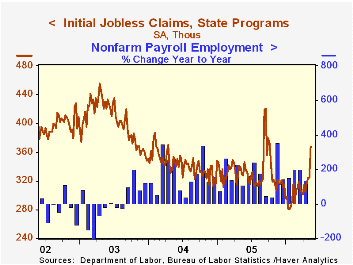
Initial unemployment insurance claims surged 42,000 last week to 367,000 due to a partial government shutdown in Puerto Rico. The shutdown added 46,000 claims and has been resolved. Consensus expectations had been for 316,000 claims.
The Labor Department indicated that excluding claims related to the government shutdown in Puerto Rico seasonally adjusted initial claims would have been closer to 312,000.
The latest figure is for the survey period for May nonfarm payrolls and claims rose 63,000 (20.7%) from the April period. The payroll survey counts persons who were paid during the week which contains the 12th of the month as employed. During the last ten years there has been a (negative) 77% correlation between the level of initial claims and the m/m change in nonfarm payrolls.
Excluding strikers, claims rose 8,000 (2.6%) from the April survey period for nonfarm payrolls.
The four week moving average of initial claims rose to 333,250 (-0.1% y/y).
Continuing claims for unemployment insurance rose 8,000 following a revised 60,000 decline during the prior week.
The insured rate of unemployment remained at 1.8%.
Job Matching: Evidence from the Beveridge Curve from the Federal Reserve Bank of San Francisco is available here.
| Unemployment Insurance (000s) | 05/13/06 | 05/06/06 | Y/Y | 2005 | 2004 | 2003 |
|---|---|---|---|---|---|---|
| Initial Claims | 367 | 325 | 11.6% | 332 | 343 | 403 |
| Continuing Claims | -- | 2,389 | -8.7% | 2,663 | 2,923 | 3,530 |
by Tom Moeller May 18, 2006
For April, the Conference Board's Composite Index of Leading Economic Indicators dipped 0.1% following a 0.4% March rise, initially reported as a 0.1% decline. Consensus expectations had been for a 0.1% April up tick.
Six month growth in the leaders fell to 2.9% from an upwardly revised 4.8% the prior month. During the last ten years there has been a 43% correlation between the six-month change in the leading indicators and quarterly growth in real GDP.
The breadth of one month gain amongst the 10 components of the leading index halved to 35% in April. Over a six month span 80% of the index components have risen. A large positive contribution from vendor performance was offset by lower building permits, lower consumer sentiment and a lower real money supply.Most of the remaining index components had little m/m impact on the change in the leaders.
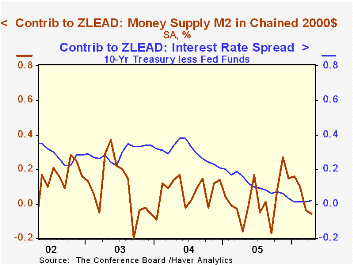
The spread between yields on the 10 year Treasury Note and Fed funds made a minimal 0.02 percentage point positive contribution to the leaders. The method of calculating the contribution to the index from the interest rate yield spread has been revised. A negative contribution will now occur only when the spread inverts rather than when declining as in the past. More details can be found here.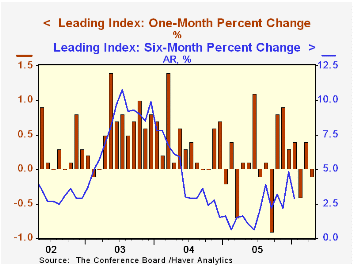
The leading index is based on eight previously reported economic data series. Two series, orders for consumer goods and orders for capital goods, are estimated.
The coincident indicators rose 0.2% for the third consecutive month. All of the four component series rose last month and during the last six months. During the last ten years there has been a 64% correlation between the change in the coincident indicators and real GDP growth.
The lagging indicators increased 0.3% following a revised 0.1% March increase. Last month, 78.6% of the series' components rose while the ratio of coincident to lagging indicators, a measure of actual economic performance versus excess, fell slightly.
Visit the Conference Board's site for coverage of leading indicator series from around the world.
Today's speech titled Basel II: Its Promise and Its Challenges by Federal reserve Board Chairman Ben S. Bernanke is available here
| Business Cycle Indicators | April | Mar | 6 Month Chg., AR | 2005 | 2004 | 2003 |
|---|---|---|---|---|---|---|
| Leading | -0.1% | 0.4% | 2.9% | 2.3% | 7.4% | 5.0% |
| Coincident | 0.2% | 0.2% | 3.5% | 2.2% | 2.5% | 0.4% |
| Lagging | 0.3% | 0.1% | 1.6% | 3.5% | 0.0% | -0.0% |
by Carol Stone May 18, 2006
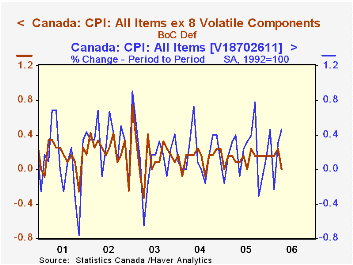
Yesterday, the report of US CPI for April set off a firestorm in financial markets as participants were hit with a bad case of inflation-itis. Today's Canadian CPI contained some of the same ingredients, but unlike the US's, Canada's "core" rate was actually weaker than expected. The total index was up just under 0.5% for the month, with the yearly rate ahead 2.4%, somewhat more than March's 2.2%. Dramatically, however, its "core" index was unchanged for the month and actually slowed on the year from 1.7% in March to 1.6%.
Canada's "core" inflation is defined by the Bank of Canada and is used directly as a monetary policy target. It excludes eight of the most volatile items, such as fresh fruits and vegetables, gasoline and mortgage interest rates. See the footnote beneath the table for the complete list.
Within the total index, energy prices played a major role in the monthly gain: all energy was up 6.9% (not seasonally adjusted), and separate data on actual retail gasoline prices show an increase of 13.7% to C$1.0675/liter, only the fourth month ever that the price has exceeded C$1.00/liter (the other three instances were just last year: August, September and October).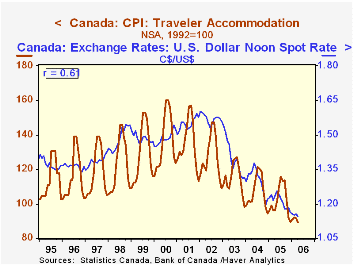
In discussing the surprising softness of the core measure, some press reports indicated a role for the Canadian dollar. It has strengthened noticeably against the US dollar, not just recently, but basically since the middle of 2002. It also moved up versus the euro from the middle of 2004 through the end of last year. So indeed, the strong currency could be helping Canadian inflation. We look at two components where imports have a significant influence, clothing and recreation. Clothing prices have been falling consistently and in April were 3% below a year earlier. By contrast in the US, the apparel category has declined much less over the last two years. Recreation is another Canadian sector with a trade component, as its residents travel south to Florida and other such destinations and residents of other areas come to Canada. The related prices in Canada are falling slowly, but their pattern changed distinctly soon after the the Canadian dollar turned upward. The chart shows "traveler accommodation" together with the US$ exchange rate; the two series have a remarkable 60% correlation since 1995.
All of Haver's Canadian monthly data are in CANSIM, an extensive collection of Statistics Canada's copyrighted series. Exchange rates can be found in USECON, DAILY, INTDAILY and the weekly counterparts of the latter two, as well as in CANSIM.
| Canada CPI, % Changes* | Apr 2006 | Mar 2006 | Feb 2006 | Year/ Year | December/December|||
|---|---|---|---|---|---|---|---|
| 2005 | 2004 | 2003 | |||||
| All Items | 0.46 | 0.31 | -0.23 | 2.44 | 2.15 | 2.12 | 1.99 |
| All Items less 8 Volatiles** | 0.00 | 0.23 | 0.16 | 1.58 | 1.59 | 1.70 | 2.15 |
| Clothing | -0.50 | -0.70 | -0.69 | -3.02 | -0.93 | -3.10 | 0.20 |
| Recreation, etc. | 0.00 | 0.00 | -0.16 | -0.16 | -0.24 | 0.32 | 0.40 |
| Memo: Can$/US$ Month Avg | 1.1438 | 1.1574 | 1.1489 | 1.2397 (2/2005) | December | ||
| 1.1610 | 1.2191 | 1.3128 | |||||

Tom Moeller
AuthorMore in Author Profile »Prior to joining Haver Analytics in 2000, Mr. Moeller worked as the Economist at Chancellor Capital Management from 1985 to 1999. There, he developed comprehensive economic forecasts and interpreted economic data for equity and fixed income portfolio managers. Also at Chancellor, Mr. Moeller worked as an equity analyst and was responsible for researching and rating companies in the economically sensitive automobile and housing industries for investment in Chancellor’s equity portfolio. Prior to joining Chancellor, Mr. Moeller was an Economist at Citibank from 1979 to 1984. He also analyzed pricing behavior in the metals industry for the Council on Wage and Price Stability in Washington, D.C. In 1999, Mr. Moeller received the award for most accurate forecast from the Forecasters' Club of New York. From 1990 to 1992 he was President of the New York Association for Business Economists. Mr. Moeller earned an M.B.A. in Finance from Fordham University, where he graduated in 1987. He holds a Bachelor of Arts in Economics from George Washington University.
More Economy in Brief


