 Global| Dec 08 2005
Initial Unemployment Insurance Claims Up Modestly
by:Tom Moeller
|in:Economy in Brief
Summary
Initial claims for unemployment insurance rose 6,000 to 327,000 last week following a revised 16,000 drop the prior week. Consensus expectations had been for 315,000 claims. Hurricane related claims dropped to 8,000 and brought the [...]
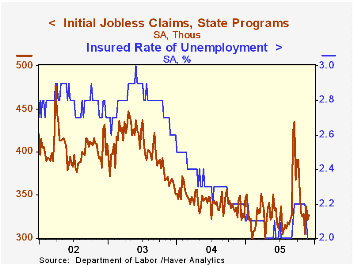
Initial claims for unemployment insurance rose 6,000 to 327,000 last week following a revised 16,000 drop the prior week. Consensus expectations had been for 315,000 claims.
Hurricane related claims dropped to 8,000 and brought the total of the three storms during the last fourteen weeks to 600,000.
The four-week moving average of initial claims was about unchanged at 322,500 (-4.8% y/y).
Continuing unemployment insurance claims fell 137,000 following a 57,000 decline the prior week which was deeper than initially reported.
The insured rate of unemployment fell to 2.0% from a downwardly revised 2.1% the prior week.
Monetary Policy with Imperfect Knowledge, a working paper from economists at the Federal Reserve board, is available here.
Can Financial Innovation Help to Explain the Reduced Volatility of Economic Activity? is another working paper published by the Federal Reserve Board and can be found here.
| Unemployment Insurance (000s) | 12/03/05 | 11/26/05 | Y/Y | 2004 | 2003 | 2002 |
|---|---|---|---|---|---|---|
| Initial Claims | 327 | 321 | -6.3% | 343 | 402 | 404 |
| Continuing Claims | -- | 2,603 | -5.9% | 2,926 | 3,531 | 3,570 |
by Carol Stone December 8, 2005
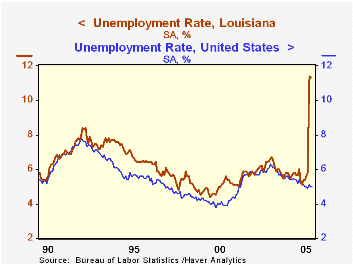
The dramatic impact of Hurricane Katrina on local Gulf Coast economies is starting to be quantified by various government statistics. These numbers do not, of course, begin to describe the devastation in the region, but they give it some relative context. The unemployment rate in Louisiana doubled in September and October, for instance, even as the national rate was fairly steady. Employment in Louisiana plunged 13.3% between August and October, and in Mississippi, by 6.5%. Unemployment for that state rose from 6.9% of the labor force in August to about 10% in September and October. [The state figures for October were published November 22; some metropolitan area data came out last week and smaller local areas, just yesterday, which occasions our commentary today.]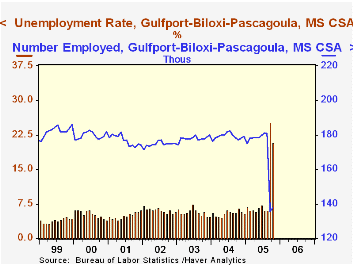
Notably, there are no data for the New Orleans metropolitan area for these two months. BLS's release of November 30 explains that the quality of the data was "severely compromised by the hurricane". People in the area simply had other priorities than responding to the Current Population Survey in those months. BLS obviously determined that this effect did not carry over to the state as a whole. Further, for the Gulfport/Biloxi/Pascagoula area, reporting was not harmed enough to undermine the figures that were obtained in the interviewing. They are still seen as a fair representation of actual employment conditions in the area.
The differential impact of the storm, and Rita that followed, are shown in the divergence between Louisiana and Mississippi of labor market behavior in October. Employment continued to decline in Louisiana, falling another 44,500, while it stabilized in Mississippi. The unemployment rates in Mississippi and in the Gulfport/Biloxi area fell markedly in October, though these remain outsized. Further in Louisiana, the labor force itself continued to shrink; after a decline of 115,600 in September, it went down another 52,900 in October. People were still leaving the state. The impact of Rita is shown by the behavior of the labor force in Lake Charles; it went up slightly in September as it became a place of refuge from New Orleans. But the later storm resulted in a noticeable decrease in October as people fled from there as well.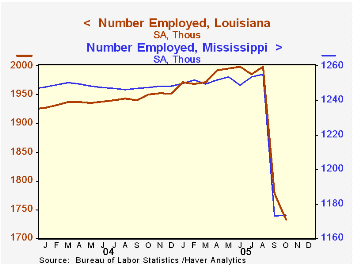
Some of these went to Texas. Data for Texas as a whole seem to show little change, but the impact is somewhat evident in the Houston Consolidated area. As seen below, the unemployment rate went up to 5.9% in September; the labor force gained 24,300 but employment went up only 6,600. In October, the labor force stabilized and jobs began to catch up, so unemployment fell back. We should issue a disclaimer here; it is perhaps asking too much of the CPS survey methods to capture this effect so quickly, although BLS says they altered population controls among states to try to account for the massive interstate migration.
Clearly this was an unprecedented period in many ways, not the least of which is data collection. It is important to be able to gauge these massive changes. Further, the labor force data received different treatment than the payroll data did. BLS's "CES" survey was carefully calibrated to generate numbers for New Orleans establishment employment; the number of payroll jobs there fell 217,300 in September, about 35%, and rose 10,600 in October. By comparison, the average monthly change in the five years to August was zero.
These labor force data are contained in Haver's EMPLR database, and payroll employment is in the LABORR database, both part of Haver's extensive regional data offerings.
| Household Employment (Thous) & Unemployment Rates: Selected Areas |
Oct 2005 | Sep 2005 | Aug 2005 | Oct 2004 | 2004 | 2003 | 2002 |
|---|---|---|---|---|---|---|---|
| Louisiana (Seas Adj): Employment | 1733.1 | 1777.6 | 1999.1 | 1949.8 | 1940.3 | 1914.6 | 1903.0 |
| Unemployment Rate (%) | 11.3 | 11.4 | 5.8 | 5.8 | 5.7 | 6.3 | 5.9 |
| New Orleans/ Metairie/Kenner (SA) Employment |
-- | -- | 602.9 | 586.7 | 585.2 | 580.0 | 579.4 |
| Unemployment Rate (%) | -- | -- | 5.5 | 4.4 | 4.6 | 5.3 | 5.3 |
| Mississippi (SA) Employment |
1173.5 | 1173.0 | 1255.0 | 1247.4 | 1248.1 | 1237.2 | 1219.1 |
| Unemployment Rate (%) | 9.6 | 10.3 | 6.9 | 6.9 | 6.2 | 6.4 | 6.7 |
| Gulfport/Biloxi/- Pascagoula CSA (NSA) Employment | 138.0 | 135.7 | 180.9 | 177.0 | 179.2 | 177.8 | 174.6 |
| Unemployment Rate (%) | 20.8 | 25.2 | 6.1 | 6.5 | 5.5 | 5.7 | 6.2 |
| Houston/Baytown/- Huntsville CSA (NSA) Employment | 2543.2 | 2533.3 | 2526.7 | 2469.1 | 2451.8 | 2417.6 | 2395.6 |
| Unemployment Rate (%) | 5.5 | 5.9 | 5.3 | 6.0 | 6.3 | 6.8 | 6.1 |

Tom Moeller
AuthorMore in Author Profile »Prior to joining Haver Analytics in 2000, Mr. Moeller worked as the Economist at Chancellor Capital Management from 1985 to 1999. There, he developed comprehensive economic forecasts and interpreted economic data for equity and fixed income portfolio managers. Also at Chancellor, Mr. Moeller worked as an equity analyst and was responsible for researching and rating companies in the economically sensitive automobile and housing industries for investment in Chancellor’s equity portfolio. Prior to joining Chancellor, Mr. Moeller was an Economist at Citibank from 1979 to 1984. He also analyzed pricing behavior in the metals industry for the Council on Wage and Price Stability in Washington, D.C. In 1999, Mr. Moeller received the award for most accurate forecast from the Forecasters' Club of New York. From 1990 to 1992 he was President of the New York Association for Business Economists. Mr. Moeller earned an M.B.A. in Finance from Fordham University, where he graduated in 1987. He holds a Bachelor of Arts in Economics from George Washington University.
More Economy in Brief

 Global| Feb 05 2026
Charts of the Week: Balanced Policy, Resilient Data and AI Narratives
by:Andrew Cates

