 Global| Nov 03 2004
ISM Non-manufacturing Index Rebounded
by:Tom Moeller
|in:Economy in Brief
Summary
The Institute for Supply Management reported that the October Business Activity Index for the non-manufacturing sector rebounded 3.1 points to 59.8 following a 1.5 point decline in September. Consensus expectations had been for a more [...]
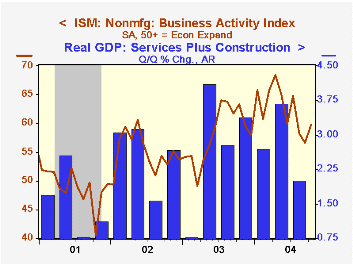
The Institute for Supply Management reported that the October Business Activity Index for the non-manufacturing sector rebounded 3.1 points to 59.8 following a 1.5 point decline in September. Consensus expectations had been for a more moderate gain to 58.0.
Despite the latest rise, the index remained well below its April high of 68.4.
Since the series' inception in 1997 there has been a 55% correlation between the Business Activity Index and the q/q change in GDP services plus construction.
The employment sub index rose again to 55.8, the highest level since June. Since the series' inception in 1997 there has been a 60% correlation between the level of the ISM non-manufacturing employment index and the m/m change in payroll employment in the service producing plus the construction industries.
The new orders index also rose to 60.5, the highest since July and the seasonally adjusted prices index rose to 74.1.
ISM surveys more than 370 purchasing managers in more than 62 industries including construction, law firms, hospitals, government and retailers. The non-manufacturing survey dates only to July 1997, therefore its seasonal adjustment should be viewed tentatively.Business Activity Index for the non-manufacturing sector reflects a question separate from the subgroups mentioned above. In contrast, the NAPM manufacturing sector composite index is a weighted average five components.
| ISM Nonmanufacturing Survey | Oct | Sept | Oct '03 | 2003 | 2002 | 2001 |
|---|---|---|---|---|---|---|
| Business Activity Index | 59.8 | 56.7 | 63.3 | 58.1 | 55.1 | 48.9 |
| Prices Index | 74.1 | 67.1 | 58.9 | 56.7 | 53.9 | 51.5 |
by Tom Moeller November 3, 2004
Factory orders fell 0.4% after a 0.3% August decline. Durable goods orders rose 0.2% and that was unrevised from the advance report. The advance report of a 2.6% rise in nondefense capital goods orders less aircraft was revised up slightly to a 2.8% (9.0% y/y).
Shipments out of the US manufacturing sector tumbled 1.1% in September due to broad based industry declines. Shipments of computers & electronic products plunged 3.5% (+8.3% y/y) and electrical equipment shipments skid 3.3% (+5.1% y/y).
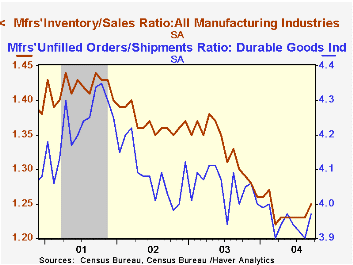
Unfilled orders rose another 0.8% and the ratio of unfilled orders to shipments for durables rose sharply suggesting that supply bottlenecks started to emerge.
Factory inventory accumulation moderated to 0.3% following an upwardly revised 0.7% August gain. The inventory to sales ratio in the factory sector rose to its highest since February.
| Factory Survey (NAICS) | Sept | Aug | Y/Y | 2003 | 2002 | 2001 |
|---|---|---|---|---|---|---|
| Inventories | 0.3% | 0.7% | 5.7% | -1.3% | -1.8% | -6.1% |
| New Orders | -0.4% | -0.3% | 10.3% | 3.7% | -1.9% | -6.7% |
| Shipments | -1.1% | 0.9% | 10.0% | 2.6% | -2.0% | -5.4% |
| Unfilled Orders | 0.8% | 0.3% | 9.6% | 4.2% | -6.1% | -5.9% |
by Tom Moeller November 3, 2004
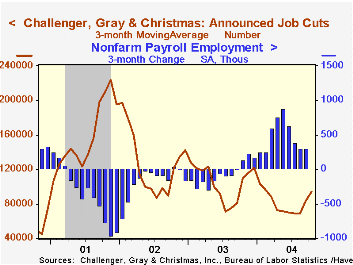
Reported job cut announcements in October remained high according to Challenger, Gray & Christmas. At 101,840, announcements were at the third highest level of the year and off just 5.6% from September when they surged 45.5% m/m.
The three month moving average of job cut announcements rose to 94,618 (-13.5% y/y), the highest since February.
During the last ten years there has been an 86% (inverse) correlation between the three month moving average of announced job cuts and the three month change payroll employment.
Job cut announcements differ from layoffs. Many are achieved through attrition, early retirement or just never occur.
| Challenger, Gray & Christmas | Oct | Sept | Y/Y | 2003 | 2002 | 2001 |
|---|---|---|---|---|---|---|
| Announced Job Cuts | 101,840 | 107,863 | -40.7% | 1,236,426 | 1,431,052 | 1,956,876 |
by Tom Moeller November 3, 2004
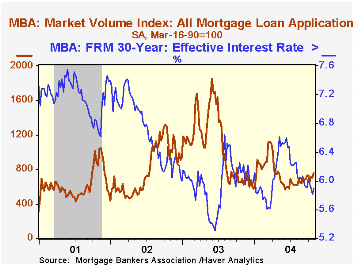
Mortgage applications jumped 8.2% last week following a slight decline the week earlier, according to the Mortgage Bankers Association (MBA). For the full month of October, applications rose 2.2% from the September average.
Purchase applications surged 12.6% but the monthly average nevertheless fell 1.2% from September. During the last ten years there has been a 60% correlation between the y/y change in purchase applications and the change in new plus existing home sales.
Applications to refinance rose a moderate 3.1% w/w but jumped 6.7% for the month.
The effective interest rate on a conventional 30-year mortgage rose to 5.90% from 5.81% the prior week and averaged 5.92% in October. The effective rate on a 15-year mortgage rose to 5.31%.
The Mortgage Bankers Association surveys between 20 to 35 of the top lenders in the U.S. housing industry to derive its refinance, purchase and market indexes. The weekly survey accounts for more than 40% of all applications processed each week by mortgage lenders. Visit the Mortgage Bankers Association site here.
| MBA Mortgage Applications (3/16/90=100) | 10/29/04 | 10/22/04 | Y/Y | 2003 | 2002 | 2001 |
|---|---|---|---|---|---|---|
| Total Market Index | 761.7 | 703.9 | 11.2% | 1,067.9 | 799.7 | 625.6 |
| Purchase | 496.5 | 440.9 | 22.8% | 395.1 | 354.7 | 304.9 |
| Refinancing | 2,303.9 | 2,233.8 | -0.7% | 4,981.8 | 3,388.0 | 2,491.0 |

Tom Moeller
AuthorMore in Author Profile »Prior to joining Haver Analytics in 2000, Mr. Moeller worked as the Economist at Chancellor Capital Management from 1985 to 1999. There, he developed comprehensive economic forecasts and interpreted economic data for equity and fixed income portfolio managers. Also at Chancellor, Mr. Moeller worked as an equity analyst and was responsible for researching and rating companies in the economically sensitive automobile and housing industries for investment in Chancellor’s equity portfolio. Prior to joining Chancellor, Mr. Moeller was an Economist at Citibank from 1979 to 1984. He also analyzed pricing behavior in the metals industry for the Council on Wage and Price Stability in Washington, D.C. In 1999, Mr. Moeller received the award for most accurate forecast from the Forecasters' Club of New York. From 1990 to 1992 he was President of the New York Association for Business Economists. Mr. Moeller earned an M.B.A. in Finance from Fordham University, where he graduated in 1987. He holds a Bachelor of Arts in Economics from George Washington University.
More Economy in Brief

 Global| Feb 05 2026
Charts of the Week: Balanced Policy, Resilient Data and AI Narratives
by:Andrew Cates

