 Global| Jan 16 2006
Japan's Balance of Payment: Net Income from Overseas Transactions Currently Is Greater than Trade in Goods Balance
Summary
Data on Japan's balance of payments for November were released today by the Ministry of Finance. The ministry reports the data in hundred millions of yen and these figures are reported in the Haver Data base but in the table below and [...]

Data on Japan's balance of payments for November were released today by the Ministry of Finance. The ministry reports the data in hundred millions of yen and these figures are reported in the Haver Data base but in the table below and in the following text we have moved the decimal point one to the left and, as a result, report the figures in billions of yen instead of the hundred millions.
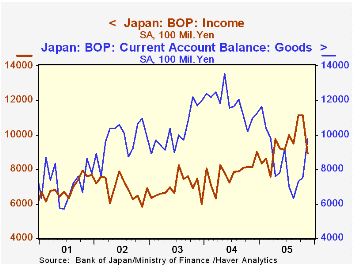
On a seasonally adjusted basis the current account in November was 1,569.8 billion yen or at the exchange rate of November 30, about $15 billion. The current account declined by 103.8 billion yen from October, but was 98.1 billion yen above November 2005. The month to month decline was due an lessening of the deficit on services of142.5 billion yen and a 220.0 billion yen decline in income on overseas transactions. Since early this year net income from overseas transactions has become a bigger factor in the current account than the balance on goods as shown in the first chart.
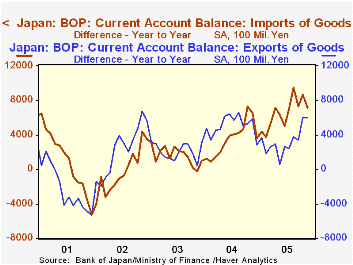
Although the trade in goods surplus increased 224.1 billion yen from October to November it was 120.0 billion yen below November of 2004. The stimulus to exports from the almost 16% depreciation of the yen over the past year was offset by the negative impact of higher oil prices on imports. The year over year change in imports and exports are shown in the second chart. Throughout this year the year over year increase in imports has outweighed that of exports.
| Japan Current Account (Billion yen) | Nov 05 | Oct 05 | Nov 04 | M/M dif | Y/Y dif | 2004 | 2003 | 2002 |
|---|---|---|---|---|---|---|---|---|
| Total Current Account | 1,569.8 | 1,673.6 | 1.471.7 | -103.8 | 98.1 | 18,594.4 | 15,828.7 | 14,040.7 |
| Balance on Goods and Services | 718.8 | 637.2 | 742.2 | 81.6 | -23.4. | 10,042.2 | 8,378.3 | 6,449.5 |
| Balance on Goods | 976.1 | 752.0 | 1,096.1 | 224.1 | -120.0 | 14,124.7 | 12,274.1 | 11,699.0 |
| Exports | 5,669.5 | 5,552.4 | 5,072.4 | 117.1 | 597.4 | 58,095.0 | 51,952.6 | 49,449.6 |
| Imports | 4,693.4 | 4,800.4 | 3,976.1 | -107.0 | 717.3 | 43,960.5 | 39,678.4 | 37,750.7 |
| Balance on Services | -257.3 | -114.8 | -353.8 | -142.5 | 98.5 | -4,082.4 | -3,895.9 | -5,249.5 |
| Net Income | 892.2 | 1,112.2 | 813.1 | -220.0 | 7901 | 9,385.5 | 8,323.1 | 8,273.4 |
| Current Transfers | -41.2 | -75.8 | -83.6 | 34.6 | 42.2 | -833.5 | -872.6 | -681.8 |


