 Global| May 14 2007
Japan's Current Account Surplus at an All Time High
Summary
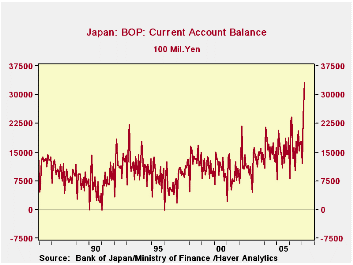
Japan's current account surplus on a seasonally unadjusted basis, was at an all time high in March at 3,317 billion yen, as can be seen in the first chart. The goods component of the surplus was 1,782.0 billion yen, and the income [...]

Japan's current account surplus on a seasonally unadjusted basis, was at an all time high in March at 3,317 billion yen, as can be seen in the first chart. The goods component of the surplus was 1,782.0 billion yen, and the income component, 1,837.9 billion yen. The 36.6 billion yen surplus on services was more than offset by a 339.4 billion yen deficit on transfers.
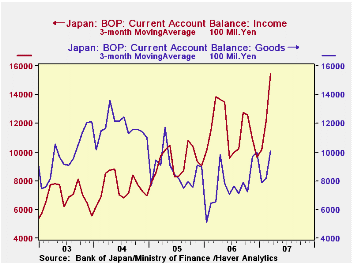
The surplus on income has become more important than the surplus on goods in the last two years, reflecting Japan's growing overseas investments. The second chart compares the three month moving averages of the goods and the income surpluses. The three month moving averages are used to mitigate some of the variation in the seasonally unadjusted data.
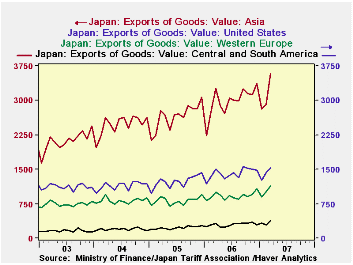
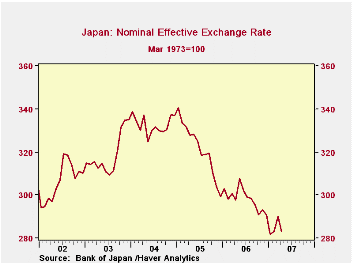
Exports of goods have been in a rising trend since 2002, with the most dynamic area in Asia. Currently, the dynamism in exports to Asia is largely responsible for the growth in total exports as exports to the United States, Europe and Central America have been more or less trend less, as shown in the third chart. A decline in the yen has contributed in part at least, to the recent growth in exports. The nominal effective exchange rate is shown in the fourth chart. This measure of the exchange rate has been declining since January, 2005 and is now 17% below that date.

| JAPAN: BALANCE OF PAYMENTS (NSA, Billion Yen) |
Mar 07 | Feb 07 | Jan 07 | Mar 06 | Y/Y Dif | 2006 | 2005 | 2004 |
|---|---|---|---|---|---|---|---|---|
| Current Account | 3317.2 | 2407.5 | 1194.6 | 2422.3 | 984.9 | 19848.8 | 18259.1 | 18618.4 |
| Goods | 1782.0 | 1118.9 | 114.0 | 1094.5 | 682.5 | 9464.3 | 10334.5 | 13902.2 |
| Income | 1837.9 | 1462.6 | 1345.7 | 1623.8 | 214.1 | 13745.9 | 11381.6 | 9273.2 |
| Services | 36.6 | -70.1 | -192.5 | 25.5 | 11.1 | -2118.0 | -2641.8 | -3706.2 |
| Transfers | -339.4 | -93.8 | -72.8 | -326.5 | -12.9 | -1243.0 | -815.0 | -851.0 |
| Geographic Distribution of Export of Goods | ||||||||
| United States | 1539.6 | 1423.6 | 1254.2 | 1502.3 | 36.4 | 16933.6 | 14805.5 | 13730.7 |
| Europe | 1136.1 | 1010.6 | 893.4 | 1001.8 | 134.3 | 11045.5 | 9740.4 | 9789.5 |
| Central and South America | 384.4 | 288.2 | 333.3 | 319.3 | 65.0 | 3555.5 | 2760.0 | 2345.2 |
| Asia | 3587.0 | 2921.3 | 2807.9 | 3259.0 | 328.0 | 37775.6 | 31795.6 | 29636.8 |


