 Global| Dec 12 2005
Japan's Second Preliminary Estimate of 3rdQ GDP Growth Rate Revised Down to 0.2% from 0.4%: Inventory Liquidation [...]
Summary
The second preliminary estimate of Japan's third quarter gross domestic product, which was published late last week, reduced the quarter-to-quarter growth rate from 0.4% to 0.2%. The major revision was a change in inventory [...]

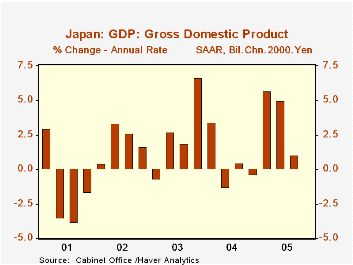
The second preliminary estimate of Japan's third quarter gross domestic product, which was published late last week, reduced the quarter-to-quarter growth rate from 0.4% to 0.2%. The major revision was a change in inventory accumulation. In the first preliminary estimate there was no change in inventories and, therefore no contribution to growth from that source, but the second preliminary estimate showed a substantial decline in inventories resulting in 0.4 percentage points being deducted from the growth rate. The other changes were a 0.1 percentage point increase in nonresidential construction and a 0.1 percentage point reduction in the import of goods and service import which, of course, is positive in relation to growth. On a seasonally adjusted annual rate basis, Japan's GDP rose 1.0% in the third quarter, down from 5.0% in the second quarter and 5.7% in the first quarter as shown in the first chart.
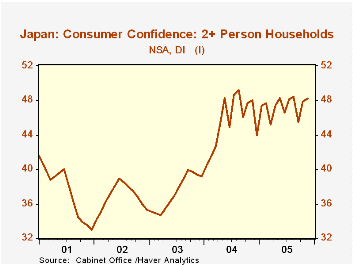
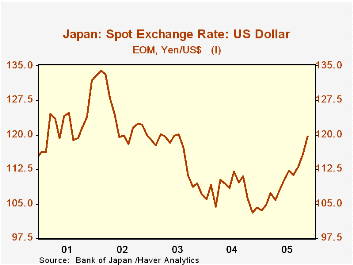
The fact that the lower estimate was due largely to a change in the estimate for inventories suggests that the deceleration in growth may not herald the specter of another false rise in Japanese growth. There are faint positive stirrings in consumer confidence. Although the diffusion index of consumer confidence is still below 50, indicating an excess of pessimists over optimists, the index has risen in both October and November suggesting that consumers may increase their spending in the fourth quarter. The Economic and Social Research Institute in the Cabinet Office now publishes monthly instead of quarterly indicators of consumer confidence, but the monthly data go back only to April, 2004. In the second chart we show the monthly data linked to the now discontinued quarterly series. While the gains in consumer confidence are tentative, there is little doubt that there has been a sharp decline in the yen this year as shown in the third chart. The lower yen has and is likely to continue to encourage exports.
| Japanese Gross Domestic Product (Billions chained 2000 Yen) |
Q3 05 % | Q2 05 % | Q1 05 % | 2004 % | 2003 % | 2002 % |
|---|---|---|---|---|---|---|
| Gross Domestic Product SA Annual Rate | 1.00 | 4.96 | 5.67 | 2.26 | 1.82 | 0.14 |
| Q/Q % | 0.25 | 1.22 | 1.39 | 2.26 | 1.82 | 0.14 |
| Household Consumption | 0.37 | 0.32 | 1.21 | 1.91 | 0.57 | 1.11 |
| Government Consumption | 0.56 | 0.23 | 0.93 | 2.00 | 2.30 | 2.38 |
| Gross Fixed Investment | 1.33 | 1.40 | 1.81 | 0.95 | 0.47 | -4.95 |
| Exports | 0.72 | 3.10 | -0.14 | 13.93 | 9.00 | 7.45 |
| Imports | 3.34 | 2.15 | -0.04 | 8.47 | 3.95 | 0.81 |
| Change in Inventories (Billions chained 2000 Yen) |
||||||
| Private | -1,915.3 | 1,539.2 | 727.3 | -1,199.6 | 1,750.7 | -2,055.9 |
| Government | 32.9 | -15.4 | -48.4 | 60.3 | 11.2 | 15.1 |
More Economy in Brief
 Global| Feb 05 2026
Charts of the Week: Balanced Policy, Resilient Data and AI Narratives
by:Andrew Cates


