 Global| Jul 02 2007
Japan's Tankan Survey: Confidence among Large Manufactures Remains Strong: Actual Results Continue Better than Forecast
Summary
The Bank of Japan's quarterly Tankan Survey, or short term business outlook, was released today. The Bank surveyed 2,469 large, 2.915 medium and 5,455 small-sized enterprises over the period from May 28 to June 29. The headline [...]

The Bank of Japan's quarterly Tankan Survey, or short term business outlook, was released today. The Bank surveyed 2,469 large, 2.915 medium and 5,455 small-sized enterprises over the period from May 28 to June 29.
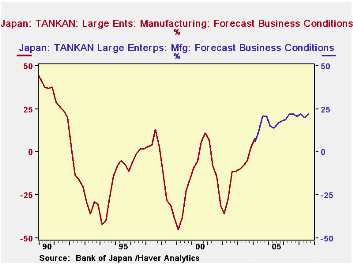
The headline series, a diffusion index for large manufacturing enterprises, rose from 20% in the March Survey to 22% in the current survey. The index has ranged between 20% and 22% since the second quarter of 2006 and has probably been the longest run of optimism manufactures have expressed since the late eighties. As noted in the Japan Data Base, major revisions in early 2004 have created a discontinuity in the time series data between December 2003 and March 2004. Pre revisions series are maintained in the data base and marked DISCONTINUED. Although they are not strictly comparable, we have plotted the DISCONTINUED and the current series in the first chart to place the current situation in a longer term perspective.
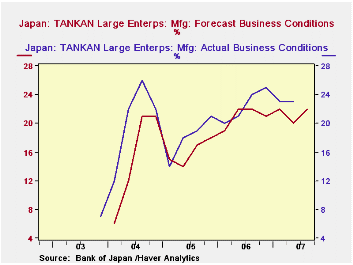
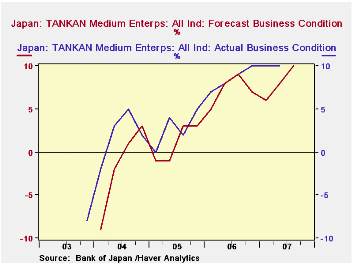
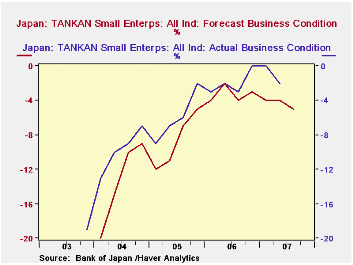
Caution on the part of the business men surveyed is evident in the fact that their forecasts have generally been below their appraisal of their actual results. The second chart compares the forecasts and appraisals of actual results for the large manufacturers. Optimists in medium-sized firms outweigh the pessimists by a margin of 10% in the current survey, but the margin has been rising as shown in the third chart. This chart also shows that medium-sized business owners, have also tended to forecast conditions below their appraisals of actual conditions. Small business owners are still pessimistic on balance. Although the degree of pessimism lessened significantly until mid 2006. it has since stagnated within a range of -2% to -4%%, as shown in the fourth chart.
| JAPAN'S TANKAN SURVEY | Q3 2007 | Q2 2007 | Q1 2007 | Q4 2006 | Q3 2006 | Q2 2006 | Q1 2006 | Q4 2005 |
|---|---|---|---|---|---|---|---|---|
| Forecast (Diffusion Indexes %) | ||||||||
| Large firms | ||||||||
| Manufacturing (HEADLINE SERIES) |
22 | 20 | 22 | 21 | 22 | 22 | 19 | 17 |
| Non Manufacturing | 23 | 23 | 20 | 21 | 21 | 19 | 17 | 16 |
| Medium-sized firms | 10 | 8 | 6 | 7 | 9 | 8 | 5 | 3 |
| Small firms | -5 | -4 | -4 | -3 | -4 | -2 | -4 | -5 |
| Actual Results (Diffusion Indexes %) | ||||||||
| Large firms | ||||||||
| Manufacturing (HEADLINE SERIES) |
-- | 23 | 23 | 25 | 24 | 21 | 20 | 21 |
| Non Manufacturing | -- | 22 | 22 | 22 | 20 | 20 | 18 | 17 |
| Medium-sized firms | -- | 10 | 10 | 10 | 9 | 8 | 7 | 5 |
| Small firms | -- | 5 | 7 | 8 | 9 | 10 | 10 | 10 |


