 Global| Feb 20 2012
Japan's Trade Deficit -- The Bank of Japan to the Rescue
Summary
Japan recorded a trade deficit of 2,496 billion yen ($19.8 billion at today's exchange rate of 79.44 yen to the dollar) in 2011, the first annual deficit since 1980. Trade continued to decline and, in January, Japan recorded the [...]
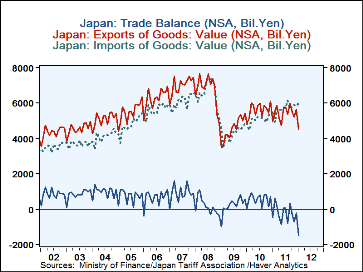
Japan recorded a trade deficit of 2,496 billion yen ($19.8 billion at today's exchange rate of 79.44 yen to the dollar) in 2011, the first annual deficit since 1980. Trade continued to decline and, in January, Japan recorded the highest monthly trade deficit, 1,475 billion yen, in its history as can be seen in the first chart. Exports declined 1,114 billion yen from 5,624 billion yen in December to 4,510 billion yen in January largely as a result of the strong yen and weak global demand. Imports were up 156 billion yen to 5,985 billion yen. The disruptions caused by last year's disasters--earthquake, tsunami, near meltdowns of nuclear facilities and floods in Thailand continue to increase the demand for foreign industrial supplies.
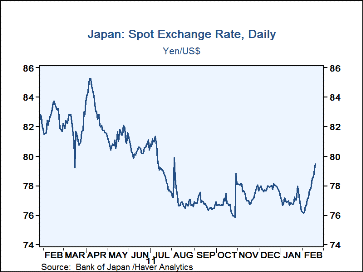
While there are many factors responsible for the deterioration in Japan's trade balance, the strong yen has probably been among the most important. Attempts to intervene in the foreign exchange market have met with little lasting effect, as can be seen in the second chart. Prospects for a more competitive yen, however, improved when the Bank of Japan did an "about face" last week. In January, the BOJ's forecast for CPI inflation was 0.5% now its a goal for inflation of 1%. The Bank increased its Asset Purchase Program by 10 trillion yen to 65 trillion yen and announced a price stability goal--"the bank will pursue monetary policy with the aim of achieving the goal of 1% in terms of the year-on-year rate of increase in CPI." While the Bank's action was not specifically targeted on the yen, its new policy is likely to lead to a cheaper yen. In the few days since the new policy was announced the yen has depreciated as can be seen in the second chart.
| Jan 12 | Dec 11 | Jan 10 | M/M Chg | Y/Y Chg | 2011 | 2010 | 2009 | 2007 | |
|---|---|---|---|---|---|---|---|---|---|
| Japan--Trade in Goods (Billion Yen) | Recent Peak Balance | ||||||||
| Exports | 4510.2 | 5624.1 | 4970.3 | -1113.9 | -460.1 | 65555 | 67400 | 54171 | 83931 |
| Imports | 5985.2 | 5829.7 | 5449.6 | 155.6 | 525.5 | 68051 | 60765 | 51499 | 78954 |
| Balance | -1475.0 | -205.6 | -479.4 | -1269.4 | -995.6 | -2496 | 6635 | 2671 | 10796 |
More Economy in Brief
 Global| Feb 05 2026
Charts of the Week: Balanced Policy, Resilient Data and AI Narratives
by:Andrew Cates


