 Global| Mar 14 2011
Japan: Some Economic Consequences of the Kobe Earthquake of 1995
Summary
While the recent earthquake in Japan in terms of lives lost and property damage, to say nothing of the potential nuclear fallout, exceeds that of the Kobe earthquake of 1995, a look at the economic statistics following that earthquake [...]
While the recent earthquake in Japan in terms of lives lost and property damage, to say nothing of the potential nuclear fallout, exceeds that of the Kobe earthquake of 1995, a look at the economic statistics following that earthquake might help in appraising the economic effects of the current earth quake. The 1995 earthquake, which occurred on January 17, 1995 measured 7.2 on the Richter Scale compared with 8.9 for the March 11, 2011 earthquake.
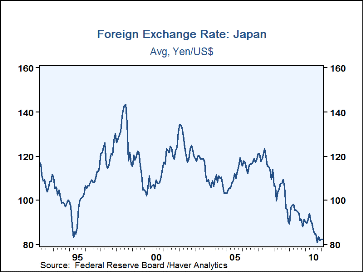
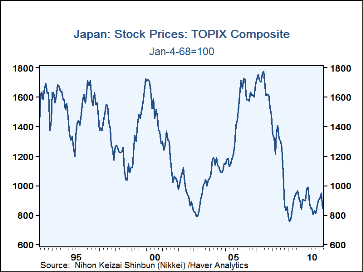
The Yen and the stock market were the first to be affected by the Kobe earthquake. The Yen appreciated at first as individuals and companies began to repatriate some of their foreign holdings. The yen reached a monthly high of 83.7 per USD by April, 1995 and then began to depreciate sharply reaching 144.87 to the dollar by August, 1998. The stock market immediately fell sharply, and continued to fall until mid year after which it had a good rise to June, 1997. Charts 1 and 2 show the courses of the yen and the stock market in the months following the 1995 earthquake.
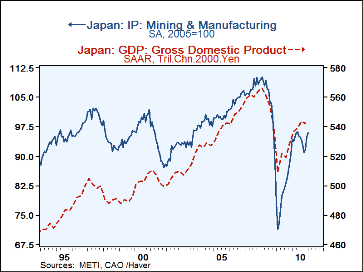
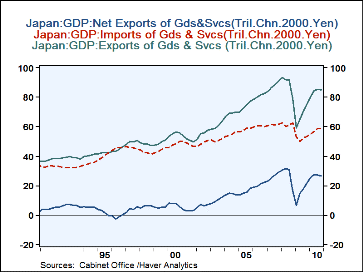
Industrial production fell 2.6% in January 1995 from the previous month, but then began to recover and continued rising. Real GDP had declined 0.69% in the fourth quarter of 1994 and actually rose 0.80% in the first quarter in spite of the earthquake. Except for the January decline in industrial production, these two broad measures of economic activity show little impact of the 1995 earthquake as can be seen in the third chart.While total GDP appears to have been unaffected by the Kobe earthquake, imports of goods and services rose rapidly in the quarters following the earthquake. Exports, meanwhile, showed no or little growth with the result that the balance on exports of goods and services declined from a positive balance of 5.1 trillion yen in the fourth quarter of 1994 to a negative balance of 2.3 trillion yen in June, 1996 as can be seen in the fourth chart.
These are only a few of the economic statistics that can be found in the Haver data base, JAPAN, that may be useful in assessing the economic impact of the March 11th earthquake
| Dec'94 | Jan'95 | Feb'95 | Mar'95 | Apr'95 | May'95 | Jun'95 | |
|---|---|---|---|---|---|---|---|
| Industrial Production (2005=100) | 95.1 | 92.6 | 94.6 | 95.5 | 96.7 | 94.8 | 95.1 |
| Yen/US$ | 100.0 | 99.9 | 98.4 | 91.0 | 83.7 | 85.2 | 84.6 |
| Topix Stock Index | 1559 | 1463 | 1348 | 1308 | 1331 | 1254 | 1197 |
| Q4'94 | Q1'95 | Q2'95 | Q3'95 | Q4'95 | Q1'96 | Q2'96 | |
| Real GDP (Trillion 2000 Chained Yen) | 471.3 | 475.3 | 479.0 | 483.7 | 483.0 | 487.3 | 192.0 |
| Exports (Trillion 2000 Chained Yen) | 41.1 | 41.2 | 42.1 | 42.4 | 42.4 | 43.2 | 43.3 |
| Imports (Trillion 2000 Chained Yen) | 36.0 | 37.3 | 38.7 | 40.8 | 42.8 | 43.8 | 45.6 |
| Net Exports (Trillion 2000 Chained Yen) | 5.1 | 3.8 | 3.4 | 1.6 | -0.4 | -0.6 | -2.3 |
More Economy in Brief
 Global| Feb 05 2026
Charts of the Week: Balanced Policy, Resilient Data and AI Narratives
by:Andrew Cates


