 Global| Aug 12 2008
Japanese Consumer Confidence In July Lowest Ever Recorded: Retail Sales Stagnant
Summary
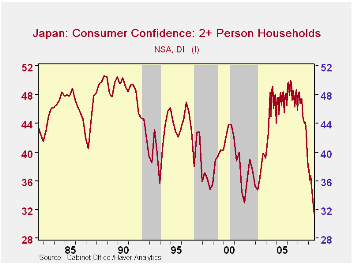
Consumer confidence in Japan, as measured by a diffusion index, declined again in July and was at the lowest level recorded since June 1982 when confidence was first measured. The history of the index is shown in the first chart. [...]

Consumer confidence in Japan, as measured by a diffusion index, declined again in July and was at the lowest level recorded since June 1982 when confidence was first measured. The history of the index is shown in the first chart. Monthly data are available only since April, 2004 and these, only on a seasonally unadjusted basis. The index was 31.4 in July.
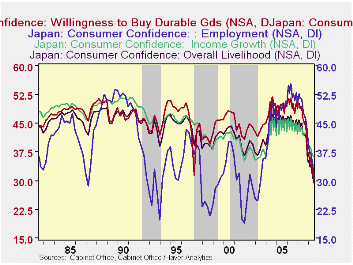
The index is the average of opinions regarding the consumers' overall livelihood, the growth of income, employment prospects and their willingness to buy durable goods. Opinions on all four have deteriorated since early 2007 and, except for the employment prospects are at all time lows, as shown in the second chart. Opinions on employment prospects have been more volatile than those on the other components of the index.
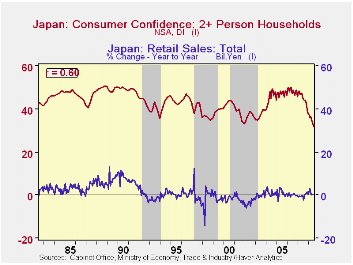
Retail sales for June were also released today. The year over year changes in retail sales in the last three months have been close to zero: 0.29% in June, 0.27% in May and 0.05% in April. The relation of consumer confidence to actual retail sales is not very strong as can be seen in the third chart that correlates consumer confidence with the year to year change in retail spending. The R2 is .36 indicating that consumer confidence explains only 36% of the year to year changes in retail sales. While low confidence might suggest lower spending, it may be that the rationale goes the other way. The acceleration in the prices of food and beverages since the beginning of the year, shown in the table below, has probably played a major role in weakening confidence.


| JAPAN | Jul 08 | Jun 08 | May 08 | Apr 08 | Mar 08 | Feb 08 | Jan 08 | 2007 |
|---|---|---|---|---|---|---|---|---|
| Consumer Confidence Diffusion Index (%) | 31.4 | 32.6 | 33.9 | 35.2 | 36.7 | 36.1 | 37.5 | 44.7 |
| Overall livelihood | 29.3 | 30.3 | 31.5 | 33.0 | 34.4 | 33.7 | 35.1 | 42.2 |
| Income growth | 36.3 | 36.5 | 36.6 | .7.5 | 38.7 | 38.5 | 39.4 | 42.6 |
| Employment | 30.7 | 32.8 | 34.9 | 36.0 | 37.6 | 37.0 | 38.6 | 48.1 |
| Willingness to buy durable goods | 29.2 | 30.9 | 32.7 | 34.2 | 36.2 | 34.8 | 36.7 | 45.7 |
| CPI: Food & Beverage (Y/Y % ) | 3.59 | 2.38 | 1.99 | 1.54 | 1.20 | 0.50 | 0.34 | |
| Retail Sales (Y/Y % ) | 0.27 | 0.29 | 0.05 | 1.04 | 3.17 | 1.31 | -0.13 |
More Economy in Brief
 Global| Feb 05 2026
Charts of the Week: Balanced Policy, Resilient Data and AI Narratives
by:Andrew Cates


