 Global| Sep 08 2008
Japanese EconomyWatchers Still in the Doldrums
Summary
In its Economy Watchers Survey the Cabinet Office in Japan surveys some 2050 individuals whose business activity is sensitive to developments that affect households, corporations and employment. Among the economy watchers are managers [...]

In its Economy Watchers Survey the Cabinet Office in Japan surveys some 2050 individuals whose business activity is sensitive to developments that affect households, corporations and employment. Among the economy watchers are managers and clerks at super markets, restaurant employees, taxi drivers, beauty parlor operators and barbers, managers and employees in manufacturing and service industries, staffs of employment agencies and temporary manpower companies.
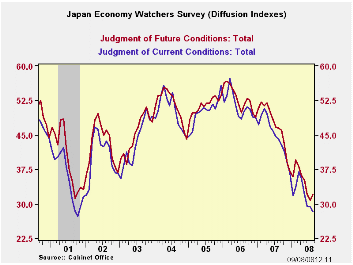
The economy watchers reported a further deterioration in August in their already depressed appraisal of current conditions for the total economy. The diffusion index was 28.3 compared with 29.3 in July and the fifth consecutive decline since March. There was, however, a slight improvement in their pessimistic expectations for the future as that diffusion index rose to 32.0 from 30.8 in July. Both indexes are well below levels reached a year ago. The current condition index is down 44.1% and the future condition index, 46.5%. Recent levels of both indexes have not been seen since the recession of the early nineties as shown in the first chart.
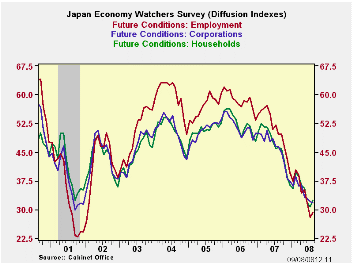
Until recently, the current and future conditions indexes for employment tended to be higher than those for households and corporations. Currently, however, the employment indexes have been deteriorating faster than those for households and corporations and are now below them as shown in the second and third charts.


| JAPAN: ECONOMY WATCHERS SURVEY (Diffusion Indexes) | Aug 08 | Jul 08 | Jun 08 | Aug 07 | Y/Y % chg | 2007 | 2006 | 2005 |
|---|---|---|---|---|---|---|---|---|
| Current Conditions | ||||||||
| Total | 28.3 | 29.3 | 29.5 | 44.1 | -35.8 | 44.9 | 51.4 | 50.3 |
| Households | 28.3 | 30.6 | 29.3 | 43.7 | -34.1 | 44.0 | 48.8 | 49.0 |
| Corporations | 28.1 | 27.7 | 31.4 | 43.1 | -34.8 | 45.1 | 51.8 | 50.5 |
| Employment | 26.0 | 24.1 | 26.4 | 48.3 | 46.2 | 49.9 | 60.2 | 57.7 |
| Future Conditions | ||||||||
| Total | 32.0 | 30.8 | 32.1 | 46.5 | -31.2 | 46.9 | 51.4 | 50.3 |
| Households | 32.5 | 30.7 | 318 | 46.1 | -29.5 | 46.6 | 52.5 | 50.9 |
| Corporations | 31.8 | 32.1 | 32.8 | 46.3 | -31.3 | 45.8 | 51.7 | 50.6 |
| Employment | 29.3 | 28.0 | 31.8 | 49.7 | -41.0 | 51.0 | 58.4 | 56.9 |
by Robert Brusca September 8, 2008

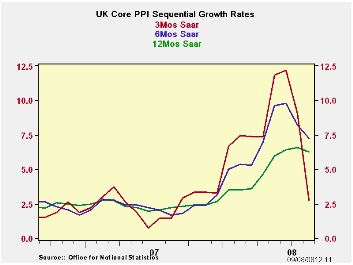
After a scintillating run of price increases, the UK’s PPI has finally fallen in August and the all-important core rate has dropped and decelerated. The accompanying chart shows the sharp break-off in the rate of PPI core inflation to just under 2.8% over three months even as its year/year rate lingers at 6.3%. Headline inflation is still at an astonishing 9.7% year/year but the three-month pace has fallen to 3.3%. The Bank of England puts a 2% ceiling on headline consumer price inflation and has no corresponding number for the PPI or for any core measure. But with oil having dominated inflation trends, the core has to be an important signal these days. The PPI tends to be more volatile than the CPI so we cannot make any firm statements about the CPI since it will include imported goods and services prices. But the trend shift in inflation’s pace is severe. The forces bringing the PPI down should translate to the CPI. The move lower has been long awaited since spot oil prices had broken from their peaks some time ago. This sort of dramatic decline could pave the way for rate cuts even with an excessive CPI pace since the drop is indicative of an ongoing process and a deflation that is sudden and severe. It unties the hands of policymakers to some extent but contains no assurances of imminent rate cuts.
| UK PPI | |||||||
|---|---|---|---|---|---|---|---|
| %m/m | %-SAAR | ||||||
| Aug-08 | Jul-08 | Jun-08 | 3-mo | 6-mo | 12-mo | 12-moY-Ago | |
| MFG | -0.4% | 0.3% | 0.9% | 3.3% | 10.3% | 9.7% | 2.4% |
| Core | -0.1% | 0.3% | 0.4% | 2.8% | 7.2% | 6.3% | 2.2% |
| Core: ex food beverages, tobacco & Petroleum | |||||||
More Economy in Brief
 Global| Feb 05 2026
Charts of the Week: Balanced Policy, Resilient Data and AI Narratives
by:Andrew Cates


