 Global| Jun 20 2011
Japanese Foreign Trade: Slow to Recover
Summary
Recent evidence suggests that the Japanese recovery from the disastrous March earthquake and tsunami is likely to be slower than originally thought due in large part to the problems at the nuclear plants. Japan's trade balance for [...]
 Recent evidence suggests that the Japanese recovery from the disastrous March earthquake and tsunami is likely to be slower than
originally thought due in large part to the problems at the nuclear plants. Japan's trade balance for May, for example,
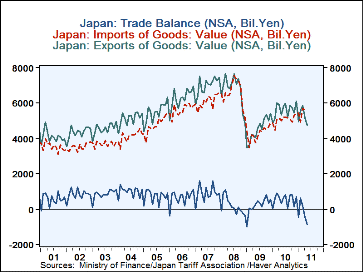
worsened although an improvement was estimated by the consensus. Japanese exports, which had declined 12.0% in April, the month
after the earthquake and tsunami, continued to decline in May and were 7.7% below April. Imports, buoyed by the need for
goods to aid those left homeless and to aid in the repair of the devastation, showed only a small declines, 0.9% in April
and 0.1% in May. As a result the balance of trade declined 464.0 billion yen in March, 651.1 billion yen in April
and 388.8 billion yen in May. The May balance was a deficit of 853.9 billion yen, the second highest on record,
exceeded only by the 967.9 billion yen trade deficit recorded in January, 2009, during the recent recession.
Japan's exports, imports and the balance of trade on a seasonally unadjusted basis are shown in the first chart. On a seasonally adjusted bases, the May balance of trade is 474.6 billion yen or 379.3 billion yen below the unadjusted figure, suggesting a more favorable position than the unadjusted data.
Since seasonally adjusted data are available only for the balance of trade, it is not possible to say whether a seasonally adjusted increase in exports or a seasonally adjusted decline in imports was responsible for the improvement.
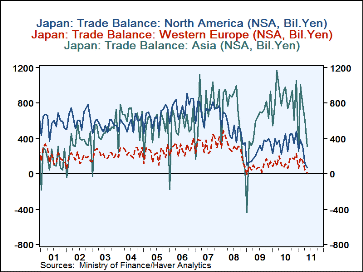
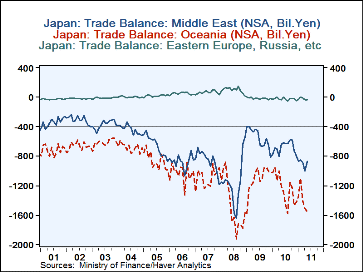
Japan typically has a trade surplus with North America, Western Europe, Asia, South and Central America and a trade deficit with the Middle East. Oceania, Russia, and Africa. The balances for May 2011 are shown below. In addition there is a second chart showing the major areas where Japan has a trade surplus and the third chart showing the major areas where Japan has a trade deficit. Again the data are seasonally unadjusted. The only improvement in the May data was a slight decline in the trade deficit with the Middle East.
| JAPAN (Bil Yen) | May'11 | Apr'11 | May'10 | M/M %Chg |
Y/Y %Chg |
2010 | 2009 | 2008 |
|---|---|---|---|---|---|---|---|---|
| Trade Balance NSA | -853.9 | -464.8 | 399.1 | -388.8* | -1162.8* | 6634.7 | 2671.2 | 2063.3 |
| Exports | 4760.8 | 5156.6 | 5308.6 | -7.7 | -10.3 | 67400.0 | 54170.6 | 81018.1 |
| Imports | 5614.5 | 5621.5 | 4999.5 | -0.1 | 12.3 | 60765.0 | 51499.4 | 78954.8 |
| Trade Balance SA | -474.6 | -469.6 | 514.6 | -5.0* | -989.1* | 6604.1 | 2556.3 | 2226.8 |
| Distribution of NSA Balance | ||||||||
| North America | 62.9 | |||||||
| Western Europe | 11.6 | |||||||
| Oceania | -288.9 | |||||||
| Africa | -59.9 | |||||||
| Asia | 308.6 | |||||||
| Middle East | -870.1 | |||||||
| Central & South America | 19.3 | |||||||
| Eastern Europe | -37.3 | |||||||
| *M/M or Y/Y difference, not percentage change | ||||||||
More Economy in Brief
 Global| Feb 05 2026
Charts of the Week: Balanced Policy, Resilient Data and AI Narratives
by:Andrew Cates


