 Global| Jan 19 2009
Japanese Mining and Manufacturing Producers in a Free Fall in November
Summary
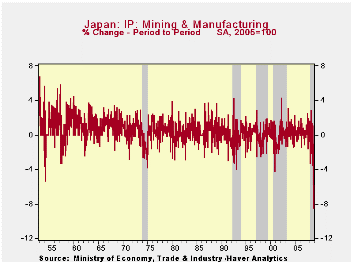
The seasonally adjusted index of industrial production in Japan fell 8.5% in November from October, the largest one-month decline in the entire history of the index that began in January 1953. (See the first chart.) Mining and [...]

The seasonally adjusted index of industrial production in Japan fell 8.5% in November from October, the largest one-month decline in the entire history of the index that began in January 1953. (See the first chart.)
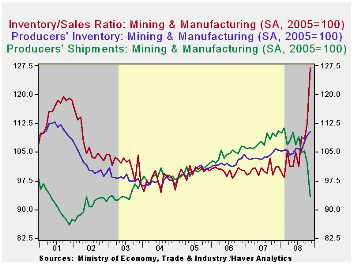
Mining and manufacturing shipments declined a record 8.4% from October to November. Although the percentage decline in production was slightly greater than the decline in shipments, inventories rose by 0.8%. The small increase in inventories and the large decline in shipments resulted in an inventory/sales ratio of 1.27 in November, the largest on record. (See the second chart.)
The rise in the inventory/sales ratio suggests that the
industrial production is unlikely to recover soon.
On a year-over-year basis, the November unadjusted industrial production index was 16.62% below November 2007, the second biggest year-over-year decline since February 1975 when the index was 19.32% below February 1974. Among the hardest hit industries were Electronic Parts and Devices, down 25.8%, Transport Equipment, down 24.4% and Electric Machinery, down 13.8%.
| JAPAN | Nov 08 | Oct 08 | Sep 08 | Aug 09 | July 08 | 2007 | 2006 | 2005 |
|---|---|---|---|---|---|---|---|---|
| Industrial Production 2005=100 (SA) | 93.6 | 102.3 | 105.6 | 104.5 | 108.3 | 107.4 | 104.5 | 100.0 |
| Month to Month % Change (SA) | -8.50 | -3.13 | 1.05 | -3.51 | 1.31 | -- | -- | -- |
| Year to Year % Change Total IP (NSA) | -16.62 | -7.05 | 0.18 | -6.90 | 2.41 | -- | -- | -- |
| Year to Year % Change Electric Machinery | -13.77 | -1.43 | 2.51 | -6.20 | 0.38 | -1.25 | 4.67 | 0.87 |
| Year to Year % Change Electronic parts and Devices | -25.85 | -12.12 | 1.44 | -6.44 | -1.79 | 11.17 | 17.82 | 1.95 |
| Year to Year % Change Transport Equipment | -24.41 | -9.61 | 2.04 | -10.11 | 19.05 | 5.75 | 5.81 | 4.79 |
| 9COLSPAN | ||||||||
| Producers' Shipments 2005=100 (SA) | 93.5 | 102.1 | 105.3 | 104.9 | 108.9 | 107.8 | 104.6 | 100.0 |
| Producers' Inventories (SA) | 110.4 | 109.5 | 107.6 | 105.5 | 105.8 | 103.9 | 102.1 | 100.0 |
| Inventory/Sales Ratio | 127.0 | 112.5 | 108.3 | 109.0 | 101.2 | 100.3 | 100.1 | 100.0 |
More Economy in Brief
 Global| Feb 05 2026
Charts of the Week: Balanced Policy, Resilient Data and AI Narratives
by:Andrew Cates


