 Global| Jul 09 2012
Japanese Statistics: Machinery Orders, Tankan and Current Account
Summary
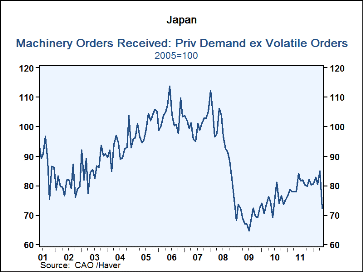
Machinery orders in Japan (Private orders excluding volatile items--ships and electric power) released today fell 14.8% in May. This is the largest month to month decline since October, 2001, raising the prospect of a slowdown in the [...]
 Machinery orders in Japan (Private orders excluding volatile
items--ships and electric power) released today fell 14.8% in May.
This is the largest month to month decline since October, 2001, raising
the prospect of a slowdown in the Japanese economy. But is this a
sure sign of a slow down? It is only one month's datum of a
series that tends to be volatile, as can be seen in the first chart.
Moreover, before the orders' data were released,results of the June Tankan were released last week. The data from the June Tankan were decidedly positive in contrast to the Orders data. In the March Tankan, Japanese business enterprises were forecasting a decline of 1.3% in capital spending for the 2012 fiscal year. In June they were forecasting a rise of 4% for fiscal 2012, Obviously the participants in the June Tankan Survey were either not aware of the May decline in orders or they minimized its significance.
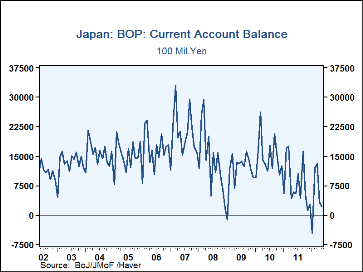
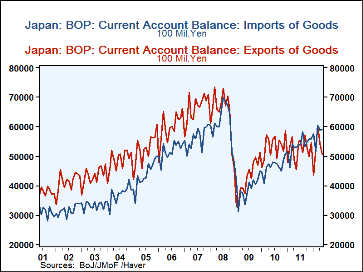
This is one example of the need to look carefully at current Japanese statistics. The Japanese economy is still being affected by various repercussion of last year's earthquake and tsunami. Another example is the current account. The current account surplus, in May, for example, was the smallest since 1985, as can be seen in the second chart . Although the high value of the yen has put a damper on exports, a good part of the recent decline in the balance on current account is due to increased imports of energy producing equipment to make up for the closure of nuclear power facilities,. The recent rise in imports can be seen in the third chart.
More Economy in Brief
 Global| Feb 05 2026
Charts of the Week: Balanced Policy, Resilient Data and AI Narratives
by:Andrew Cates


