 Global| Dec 21 2009
Japanese Trade Balance Improves
Summary
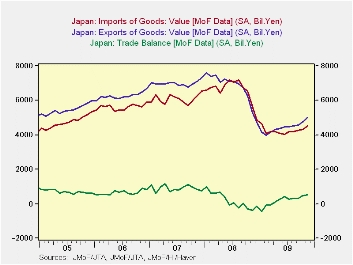
Japanese balance of trade continues to improve in spite of the high and rising yen. In November the seasonally adjusted trade balance was 492.4 billion yen, up from the low point reached in January, 2009 when the balance was a [...]
 Japanese balance of trade continues to improve in spite of the
high and rising yen. In November the seasonally adjusted trade balance
was 492.4 billion yen, up from the low point reached in January, 2009
when the balance was a negative 478 billion yen and it is now at the
highest level since April 2008 when the balance was 660 billion yen.
Exports reached a peak of 7,591.4 billion yen in January, 2009 and declined to 3,983.0 in February, 2009. Since then, they have risen to 4,998.0 billion yen. Imports reached a peak in August, 2008 at 7, 209.l and declined to 4.030.6 billion yen in June, 2009. Imports have since recovered to 4,506.1 billion yen. The trends of exports, imports and trade balance are shown in the first chart.
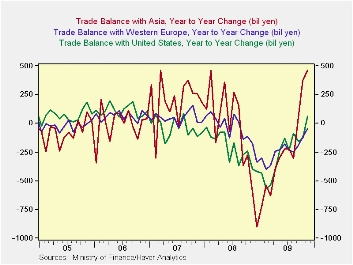
 Data on trade by area are not seasonally adjusted. As a
result, trends in these data are best shown by the year over year
changes. The year to year changes for Japan's trade with Asia, Western
Europe and the United States are shown in the second chart. The year to
year change in the trade balance with Asia is the most striking. It has
been positive and increasing since September of the year. The year to
year change in the trade balance with Western Europe is still negative,
but the magnitude of the difference, -44.5 billion yen, is greatly
lower than the -246.4 billion yen recorded in August. 2009. The year to
year change in the trade balance with the United States has also
improved and, for the first time in over two years, was positive.
| JAPAN TRADE IN GOODS | Nov 09 | Oct 09 | Nov 08 | M/M CHG | Y/Y CHG | 2008 | 2007 | 2006 |
|---|---|---|---|---|---|---|---|---|
| Trade Balance (SA bil yen) | 492.4 | 460.8 | 368.6 | 31.6 | 861.0 | 2244.5 | 10854.4 | 7762.4 |
| Exports | 4998.9 | 4765.3 | 5293.6 | 233.2 | -295.1 | 80916.2 | 83856.4 | 75144.4 |
| Imports | 4506.1 | 4304.6 | 5662.2 | 201.6 | -1156.1 | 78671.7 | 73002.0 | 67382.0 |
| Year to Year Change (bil yen) | Nov 09 | Oct 09 | Sep 09 | Aug 09 | Jul 09 | Jun 09 | May 09 | Apr 09 |
| Trade Balance with Asia | 460.8 | 372.1 | 53.1 | -303.0 | -224.9 | -221.1 | -298.2 | -388.1 |
| Trade Balance with Western Europe | -44.5 | -119.6 | -194.8 | -246.4 | -237.3 | -182.8 | -227.4 | -241.6 |
| Trade Balance with U.S.A | 59.7 | -132.4 | -155.2 | -86.5 | -232.8 | -129.2 | -234.7 | -398.8 |
More Economy in Brief
 Global| Feb 05 2026
Charts of the Week: Balanced Policy, Resilient Data and AI Narratives
by:Andrew Cates


