 Global| Aug 03 2009
Japanese Wages Continue To Decline In June
Summary
Cash earnings, including bonuses, for Japanese workers in all establishments of 5 or more persons were 430,620 Yen (approximately $4,500) in June, 8% below a year ago. The sharp decline was due to lower bonuses and less overtime pay. [...]

Cash earnings, including bonuses, for Japanese workers in all establishments of 5 or more persons were 430,620 Yen (approximately $4,500) in June, 8% below a year ago. The sharp decline was due to lower bonuses and less overtime pay. The average bonus in June of this year was 167,044 yen compared with 197,226 yen last June, a decline of more than 15%. Overtime pay was 15,725 yen compared with 19,275 yen a year ago, a decline of 18.42% and, although the decline was small, even base pay declined 1.4% to 247,851 yen from 251,437 yen a year ago.
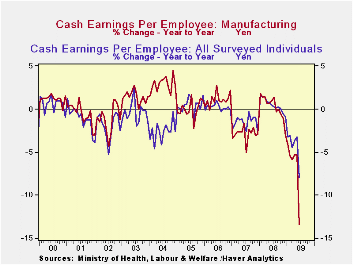
Cash earnings in the manufacturing industry in establishments of 5 or more persons were down over 13% in June. Again, bonuses were the major cause of the decline. Bonuses in Manufacturing were 155,298 yen in June 2009, compared with 209,309 yen in June 2008, a drop of almost 40%. In contrast to industry as a whole, manufacturing saw an increase in base pay of 1.5% and an increase of 5.7% in overtime from May to June.
Total cash wages for all surveyed industries and for manufacturing are shown in the attached chart.
| Japan Wages (Average monthly data in yen) | Jun 09 | May 09 | Jun 08 | M/M % | Y/Y % | 2008 | 2007 | 2006 |
|---|---|---|---|---|---|---|---|---|
| All Industries | ||||||||
| Schedule wages | 247851 | 242451 | 251437 | 1.39 | -1.43 | 251069 | 249749 | 252809 |
| Overtime | 15725 | 15940 | 19275 | -1.35 | -18.42 | 19147 | 19753 | 19805 |
| Total=Contractual Wages | 263576 | 260391 | 270712 | 1.22 | -2.64 | 270515 | 2695B02 | 272614 |
| Bonuses | 167044 | 7928 | 197226 | n.m. | -15.30 | 60538 | 60396 | 62844 |
| Total Cash Wages | 430620 | 268319 | 467938 | n.m | -7.97 | 331053 | 329898 | 335438 |
| Manufacturing | ||||||||
| Schedule wages | 267443 | 263356 | 269229 | 1.55 | -0.66 | 267625 | 265482 | 271803 |
| Overtime | 19424 | 18351 | 31988 | 5.69 | -39.28 | 30963 | 33025 | 34168 |
| Total=Contractual Wages | 286867 | 281737 | 301217 | 1.82 | -4.76 | 298588 | 298507 | 305972 |
| Bonuses | 155298 | 5836 | 209309 | n.m. | -25.80 | 75644 | 75664 | 59515 |
| Total Cash Wages | 442165 | 287573 | 510526 | n.m. | -13.39 | 374231 | 374171 | 385487 |
| N.M. presented in the table is because of the distortions in the monthly data due to the distribution of Bonuses in mid and end years, the month to month data for bonuses and total cash wages are not meaningful | ||||||||


