 Global| Aug 06 2007
June manufacturing New Orders in Germany Rise Sharply While Sales Show a Small Decline
Summary
German new orders for manufacturing in nominal terms rose 4.65% in June from May. This was the largest month to month rise since December, 2004. The rise was due almost entirely to a rise in foreign orders, which rose 8.90% from May [...]

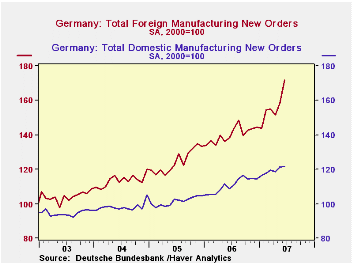
German new orders for manufacturing in nominal terms rose 4.65% in June from May. This was the largest month to month rise since December, 2004. The rise was due almost entirely to a rise in foreign orders, which rose 8.90% from May and 24.04% from June 2006. Domestic orders rose only 0.41% in June from May and were 11.75% above June 2006. Indexes for domestic and foreign new orders are shown in the first chart.
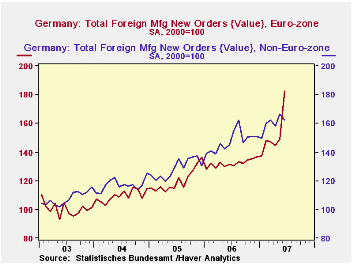
The rise in foreign orders came from a 22.39% increase in orders from other Euro Zone countries. Orders from non Euro Zone countries actually declined by 2.70% in June, due perhaps to the continued rise in the Euro. Indexes of new orders from Euro Zone countries and non Euro Zone countries are shown in the second chart
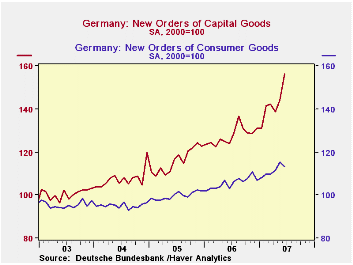
The composition of German manufacturing new orders is heavily weighted by capital goods, reflecting Germany's engineering expertise. Capital goods new orders increased 8.61% in June from May, while consumer goods new orders declined 1.48% in the same period. Manufacturing new orders of capital and consumer goods are shown in the third chart.
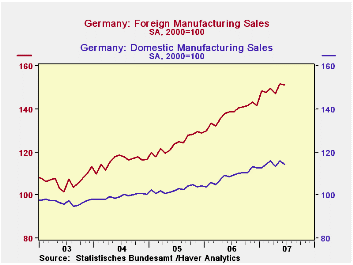
Manufacturing sales, in contrast to new orders, declined 0.77% in June from May and were 7.02% above June, 2006. Domestic manufacturing sales were down 1.21% in June, while foreign sales managed a small increase of 0.20%. Foreign sales continue to be more dynamic than domestic as can be seen in the fourth chart. The increase in sales to other Euro Zone countries was a mere 0.07% and sales to non Euro Zone countries declined 0.44%.

| GERMAN NEW ORDERS AND SALES (Nominal (2000=100)) | Jun 07 | May 07 | Jun 06 | M/M Chg | Y/Y Chg | 2006 | 2005 | 2004 |
|---|---|---|---|---|---|---|---|---|
| New Orders | 144.0 | 137.6 | 122.1 | 4.65 | 17.94 | 123.9 | 111.7 | 105.0 |
| Domestic | 121.7 | 121.2 | 108.9 | 0.41 | 11.75 | 110.9 | 101.4 | 98.3 |
| Foreign | 171.8 | 158.2 | 138.5 | 8.60 | 24.02 | 140.1 | 127.4 | 113.5 |
| Euro Zone | 182.6 | 149.2 | 131.3 | 22.39 | 39.07 | 132.1 | 120.4 | 109.6 |
| Non Euro Zone | 161.9 | 166.4 | 145.1 | -2.70 | 11.58 | 147.4 | 128.6 | 117.1 |
| Capital Goods | 156.5 | 144.1 | 123.9 | 8.61 | 26.31 | 127.5 | 116.1 | 107.5 |
| Consumer Goods | 113.5 | 115.2 | 102.9 | -1.48 | 10.30 | 105.7 | 99.8 | 95.1 |
| Sales | 128.1 | 129.1 | 119.7 | -0.77 | 7.02 | 119.6 | 110.6 | 105.5 |
| Domestic | 114.4 | 115.8 | 108.5 | -1.21 | 5.44 | 108.8 | 102.7 | 99.4 |
| Foreign | 151.3 | 151.6 | 138.5 | -0.20 | 9.24 | 137.8 | 123.9 | 115.8 |
| Euro Zone | 144.5 | 144.4 | 131.8 | 0.07 | 9.64 | 131.1 | 119.5 | 113.4 |
| Non Euro Zone | 157.8 | 158.5 | 145.0 | -0.44 | 8.83 | 144.2 | 128.1 | 118.1 |
More Economy in Brief
 Global| Feb 05 2026
Charts of the Week: Balanced Policy, Resilient Data and AI Narratives
by:Andrew Cates


