 Global| Aug 19 2002
Leading Indicators Fall
by:Tom Moeller
|in:Economy in Brief
Summary
The Composite Index of Leading Economic Indicators fell slightly less than expected last month. It was the third decline in the index during the last four months. June figures were revised down and now show a decline versus the [...]
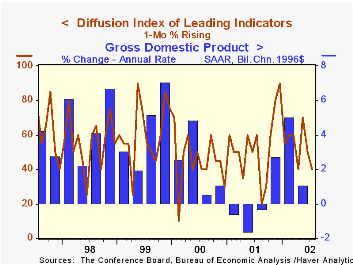
The Composite Index of Leading Economic Indicators fell slightly less than expected last month. It was the third decline in the index during the last four months. June figures were revised down and now show a decline versus the previously reported no change.
The ratio of coincident-to-lagging indicators was unchanged following five successive months of gain. The ratio is an indicator of excess relative to actual economic performance.
The coincident indicators rose for the fifth consecutive month. The lagging indicators rose for the first month since September of last year, due to higher unit labor costs and consumer debt relative to income .
Only 40% of the leaders' component series rose last month versus 50% that rose in June. Lower stock prices and lower consumer expectations had large negative influences on the leading index.
The Leading index is based on eight previously reported economic data series and two that are estimated.
| Business Cycle Indicators | July | June | Y/Y | 2001 | 2000 | 1999 |
|---|---|---|---|---|---|---|
| Leading | -0.4% | -0.2% | 1.7% | -0.6% | 1.0% | 3.3% |
| Coincident | 0.1% | 0.3% | -1.0% | 0.3% | 3.4% | 3.2% |
| Lagging | 0.1% | -0.3% | -3.9% | -1.3% | 2.8% | 1.8% |
by Tom Moeller August 19, 2002
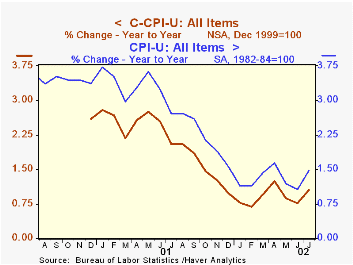
With the release of the July CPI, the Bureau of Labor Statistics began publishing a series called the chained CPI. Unlike the official CPI, the new index reflects changes in consumer spending patterns (weight shifts). It therefore is a better measure of consumers' cost of living.
The chained CPI reflects consumers preference to increase spending on goods and services which are falling in price relative to others. Much of the recent difference between the two CPI measures is due to the falling price of, and increased spending on, computers.
For a complete discussion of the technical details of the new chained CPI, visit the BLS website: http://www.bls.gov/cpi/superlink.htm
The new chained CPI is analogous to the PCE deflator published by the Bureau of economic Analysis.
For a discussion of the use of chain weighted data, visit the site below. http://www.frbsf.org/publications/economics/letter/2002/el2002-22.pdf
| Consumer Price Index | July | June | Y/Y | 2001 | 2000 | 1999 |
|---|---|---|---|---|---|---|
| Official | 0.1% | 0.1% | 1.5% | 2.8% | 3.4% | 2.2% |
| Less Food & Energy | 0.2% | 0.1% | 2.3% | 2.7% | 2.4% | 2.1% |
| Chained (NSA) | 0.0% | 0.1% | 1.1% | 2.1% | 2.0% | n.a. |
| Less Food & Energy (NSA) | 0.0% | -0.1% | 1.6% | 1.9% | 1.4% | n.a. |

Tom Moeller
AuthorMore in Author Profile »Prior to joining Haver Analytics in 2000, Mr. Moeller worked as the Economist at Chancellor Capital Management from 1985 to 1999. There, he developed comprehensive economic forecasts and interpreted economic data for equity and fixed income portfolio managers. Also at Chancellor, Mr. Moeller worked as an equity analyst and was responsible for researching and rating companies in the economically sensitive automobile and housing industries for investment in Chancellor’s equity portfolio. Prior to joining Chancellor, Mr. Moeller was an Economist at Citibank from 1979 to 1984. He also analyzed pricing behavior in the metals industry for the Council on Wage and Price Stability in Washington, D.C. In 1999, Mr. Moeller received the award for most accurate forecast from the Forecasters' Club of New York. From 1990 to 1992 he was President of the New York Association for Business Economists. Mr. Moeller earned an M.B.A. in Finance from Fordham University, where he graduated in 1987. He holds a Bachelor of Arts in Economics from George Washington University.
More Economy in Brief

 Global| Feb 05 2026
Charts of the Week: Balanced Policy, Resilient Data and AI Narratives
by:Andrew Cates

