 Global| Feb 26 2007
Less State and More Private Industrial Production in Vietnam
Summary
The Socialist Republic of Vietnam released data on industrial production today. The data are not seasonally adjusted and are in terms of 1994 Dongs. The dong is the unit of currency in Vietnam. At the end of January, the exchange rate [...]

The Socialist Republic of Vietnam released data on industrial production today. The data are not seasonally adjusted and are in terms of 1994 Dongs. The dong is the unit of currency in Vietnam. At the end of January, the exchange rate was 16,035.5 dongs to the U. S. dollar.
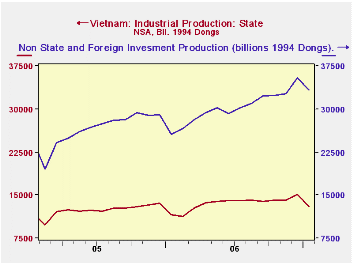
Total industrial production was 46,155 billion 1994 dongs in January, down 8.7% from December, 2006, but 23.8% above January, 2006. 31% was produced by the state sector of the economy, 31%, by the non state sector and 38% by the foreign investment sector. Although we have only two years of data, it does appear that production in the non state and foreign investment sectors are growing at the expense of production by the state sector.The year to year change in state production in January was 11.1%, while the year to year changes in the non state and foreign investment production were respectively, 32.6% and 27.0%. The first chart compares industrial production produced in the state sector with that produced by the non state and the foreign investment sectors combined.
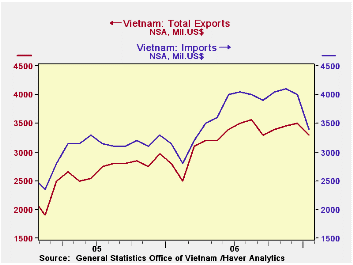
Data were also released on exports and imports. For the two years that data are available Vietnam has been running a deficit on trade in goods. The deficit has declined as can be seen in the second chart that shows imports and exports. Moreover, with the growth in the production in the foreign investment most of which is designed for export, the balance of trade in goods may continue to improve.
| VIETNAM | Jan 07 | Dec 06 | Jan 06 | M/M % | Y/Y % | 2006 | 2005 |
|---|---|---|---|---|---|---|---|
| Industrial Production (Bil. 1994 Dongs) |
46155 | 50535 | 37297 | -8.67 | 23.78 | 43835 | 38725 |
| State | 12963 | 15097 | 11671 | -14.14 | 11.07 | 13584 | 12346 |
| Non State | 15699 | 17366 | 11837 | -9.60 | 32.63 | 13677 | 11918 |
| Foreign Direct Investment | 17493 | 18071 | 13779 | -3.20 | 26.95 | 16573 | 14461 |
| Foreign Trade Balance (Bil. US $) | -100 | -500 | -350 | 400* | 250* | 5430 | 5055 |
| Exports | 3300 | 3500 | 28 | -5.71 | 17.86 | 38920 | 31198 |
| Imports | 3400 | 4000 | 3150 | -15.00 | 7.94 | 44350 | 36252 |
More Economy in Brief
 Global| Feb 05 2026
Charts of the Week: Balanced Policy, Resilient Data and AI Narratives
by:Andrew Cates


