 Global| Oct 20 2009
Manufacturing New Orders in France and Italy
Summary
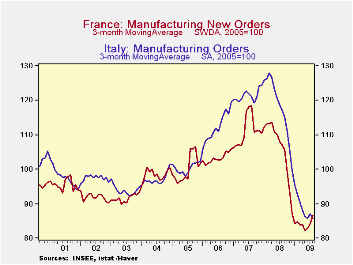
The steep declines in new orders in France and Italy that the recession exacted are beginning to show some signs of leveling out. New orders in France and Italy on a three-month moving average basis that smoothes out some of the [...]

The steep declines in new orders in France and Italy that the recession exacted are beginning to show some signs of leveling out. New orders in France and Italy on a three-month moving average basis that smoothes out some of the month- to- month variation are shown in the first chart. The turnaround in France appears stronger than that in Italy. The index of French new orders in Manufacturing actually increased 3.0% in August from 87.0 (2005=100) to 89.6 but it was still 13.8% below the year ago level. At the same time, the index of Italian new orders actually declined 8.6% from 88.8 to 81.2 and was 29.8% below the year ago level.
In general, the index of new orders in Italy has been higher than that of France; and, in spite of France's better performance relative to Italy's in August, the index of Italian new orders so far this year has exceeded that of France. The average level of the index of new orders over the period January through August was 87.3 for Italy and 84.6 for France. It should be noted that comparisons of indexes between countries say nothing about actual levels in the two countries; they merely indicate that, currently, new orders in Italy compared to their level in 2005 are higher than the corresponding measures in France.
Foreign orders accounted for the big decline in the actual index of Italian orders in August. Foreign orders dropped 12.8% from 96.8 in July to 84.4 in August. In France new foreign orders actually increased 0.7% from 86.4 in July to 87.0 in August. However, on a three month average basis, which is shown in the second chart, the July increase in Italy's foreign orders has been followed by relative stability in August. In France, the upward trend started in May and has continued through August.
| Year to Date Avg | Aug 09 | Jul 09 | Aug 08 | M/M % | Y/Y& | 2008 | 2007 | 2006 | |
|---|---|---|---|---|---|---|---|---|---|
| Total New Orders | |||||||||
| Italy | 87.1 | 81.2 | 88.8 | 115.7 | -8.56 | -29.82 | 115.8 | 121.4 | 114.1 |
| France | 84.6 | 89.6 | 87.0 | 103.9 | 2.99 | -13.76 | 104.0 | 111.4 | 103.6 |
| Foreign New Orders | |||||||||
| Italy | 71.4 | 84.4 | 96.8 | 120.1 | -12.81 | -29.73 | 121.8 | 131.3 | 117.8 |
| France | 64.0 | 87.0 | 86.4 | 101.7 | -.69 | -14.45 | 104.6 | 115.8 | 106.6 |


