 Global| May 11 2009
March Industrial Production Data For Italy And France
Summary
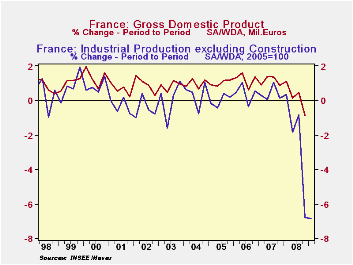
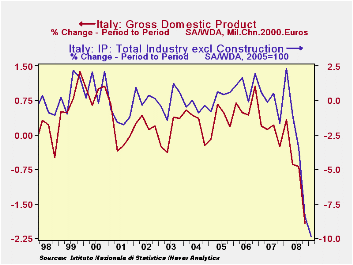
On a seasonally adjusted basis, industrial production in France declined 1.4% from February to March; and, in Italy, 4.6.%. For the quarter industrial production in France was down 6.8% compared with 6.9% in the fourth quarter. The [...]

On a seasonally adjusted basis, industrial production in
France declined 1.4% from February to March; and, in Italy, 4.6.%. For
the quarter industrial production in France was down 6.8% compared with
6.9% in the fourth quarter. The comparable figures for Italy were 8.4%
and 9.8%. To the extent that industrial production is a predictor of
gross domestic product, these figures suggest that the first quarter
decline in GDP in France will be about the same as in the fourth
quarter of last year, that is, 1.12% (or 4.4% at an annual rate), while
that in Italy is likely to be somewhat greater than the 1.49% (or 7.5%
at an annual rate) in the fourth quarter of last year. The first chart
shows quarterly data for industrial production and GDP for France and
the second, the similar data for Italy.
These production data indicate the depth and severity of the recession in these countries in the first quarter, but should not detract from the implications of more recent data such as the purchasing managers surveys and business confidence measures that suggest that the these economies are, at worst reaching a bottom or at best, showing faint signs of improvement.
One can even see some light in the monthly unadjusted production data. The year over year decline in industrial product in France was 12.6% in March, down from 18.6% in February. The comparable figures for Italy were 18.2% and 24.1%
| Mar 09 | Feb 09 | Jan 09 | Mar 09 | Feb 09 | Jan 09 | |
|---|---|---|---|---|---|---|
| Italy | Index | Index | Index | M/M % | M/M % | M/M % |
| Industrial Production SA | 80.8 | 84.7 | 88.8 | -4.60 | -4.62 | 1.22 |
| (2005=100) | Y/Y % | Y/Y % | Y/Y % | |||
| Industrial Production NSA | 81.6 | 85.4 | 90.6 | -18.23 | -24.09 | -22.80 |
| France | M/M % | M/M % | M/M % | |||
| Industrial Production SA | 84.6 | 85.5 | 86.2 | -1.37 | -0.91 | -3.92 |
| (2005=100) | Y/Y % | Y/Y % | Y/Y % | |||
| Industrial Production NSA | 93.0 | 85.5 | 89.0 | -12.59 | -18.57 | -16.04 |


