 Global| Jul 23 2012
May Growth in World Trade Improved But Growth in World Production Slowed
Summary
May data for world trade and production were released today by the CPB Netherlands Bureau for Economic Policy Analyses. (The data are found in the G10 Haver Data Base.) The CPB is part of the Netherland Ministry of Economic Affairs, [...]
 May data for world trade and production were released
today by the CPB Netherlands Bureau for Economic Policy Analyses.
(The data are found in the G10 Haver Data Base.) The CPB is part of
the Netherland Ministry of Economic Affairs, Agriculture and Innovation,
but it functions as an independent research unit that provides
economic policy analyses. It provides the most up to date trade
data, well before the OECD, the IMF and the WTO who also publish world
trade data. The CPB also publishes production data covering the same
countries that are in the trade data.
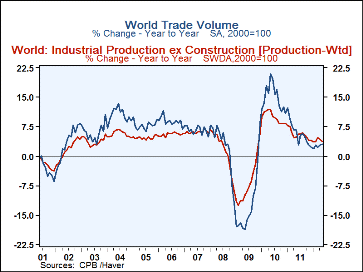
World trade recovered rapidly from its decline in the global crisis. The year to year increase reached 20.80% in May 2010. Since then the year to year growth has trended downward and now appears to have settled at roughly 3% growth. This compares with an average growth rate of 6.16% over the period, January 1991 to date, during which the data are available. The monthly data for April and May were slight increases--2.90% and 3.03%, suggesting that the second quarter volume of trade could show an increase over the first quarter.
The recovery in world production from the global crisis was more subdued than that in trade, but it followed the same general pattern. After good recovery in 2009 and early 2010, year to year growth began to taper off and appears to have averaged about 4% growth in recent months, somewhat above the long term average growth rate of 3.34%. Contrary to the path of growth in trade, growth in production declined from 4.24% in April to 3.72% in May and it looks as if the second quarter might come in below the first. The year to year growth rates in world trade and production are shown in the first chart.
| May '12 | Apr '12 | Mar '12 | Feb '12 | Jan '12 | Q1 | |
|---|---|---|---|---|---|---|
| World Trade (Y/Y % Change) | 3.03 | 2.90 | 2.25 | 2.90 | 1.93 | 2.36 |
| World Production (Y/Y % Change) | 3.72 | 4.25 | 4.64 | 3.77 | 3.49 | 3.97 |
| World Trade (2000=100) | 170.43 | 166.30 | 167.68 | 167.61 | 167.22 | 167.50 |
| World Production (2000=100) | 146.41 | 145.69 | 146.70 | 146.38 | 145.54 | 146.21 |
More Economy in Brief
 Global| Feb 05 2026
Charts of the Week: Balanced Policy, Resilient Data and AI Narratives
by:Andrew Cates


