 Global| Aug 04 2009
Mixed Signals From Down Under
Summary
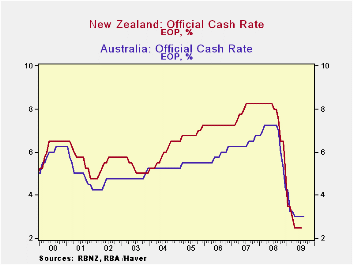
The official policy interest rates in both Australia and New Zealand have been unchanged since May of this year--Australia at 3% and New Zealand at 2.5%, as can be seen in the first chart. In recent news releases, Glenn Stevens, the [...]

The official policy interest rates in both Australia and New
Zealand have been unchanged since May of this year--Australia at 3% and
New Zealand at 2.5%, as can be seen in the first chart. In recent news
releases, Glenn Stevens, the Governor of the Bank of Australia, hinted
that the next move might be an increase while Alan Bollard, Governor of
the Bank of New Zealand would not rule out further reductions.
Typical of the cross currents affecting these economies are
today's updates of the Haver data bases for the two countries. In
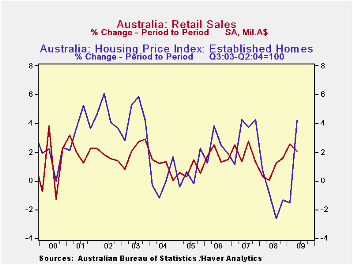
Australia, retail sales were down slightly in June, but on a quarterly
basis, the second quarter was 2% above the first quarter and almost 8%
above the second quarter of 2008.  An index of house prices of
established homes in eight capital cities increased 4.2% in the second
quarter from the first quarter of this year and was only 1.4% below the
value of the index in the second quarter of 2008. The quarter to
quarter changes in retail sales and house prices are shown in the
second chart.
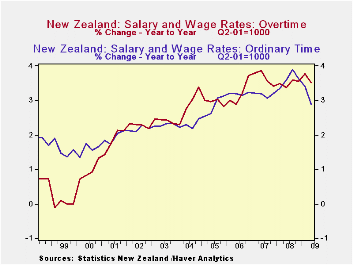
 In New Zealand wages and salaries are still rising, both for
ordinary hours and for overtime, but the rate of increase has declined
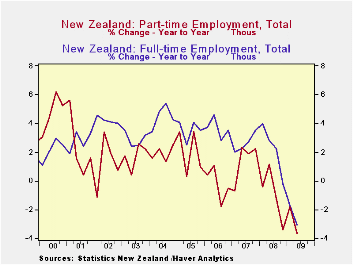
in the past few quarters, as shown in the third chart. Employment
continues to decline and was 0.75% lower in the second quarter than in
the first quarter and more than 3% lower than the second quarter of
2008. Part Time and Full Time employment trends are shown in the fourth
chart.
| Q2 09 | Q1 09 | Q2 08 | Q/Q % | Y/Y % | 2008 | 2007 | 2006 | |
|---|---|---|---|---|---|---|---|---|
| AUSTRALIA | ||||||||
| Retail Sales (Millions A$) | 58,615 | 57,426 | 54,406 | 2.07 | 7.67 | 219,968 | 211,255 | 195.254 |
| House Price Index (Q2,2003-Q2,2004=100) | 128.1 | 122.9 | 129.4 | 4.23 | -1.39 | 128.0 | 122.7 | 110.2 |
| NEW ZEALAND | ||||||||
| Employment (000) | 1355 | 1365 | 1400 | -0.75 | -3.19 | 1392 | 1370 | 1338 |
| Wages Ordinary Time (Q2 2001=1000) | 1244 | 1240 | 1209 | 0.32 | 2.89 | 1216 | 1174 | 1138 |
| Wages Over Time (Q2 2001=1000) | 1268 | 1262 | 1225 | 0.48 | 3.51 | 1233 | 1192 | 1150 |
More Economy in Brief
 Global| Feb 05 2026
Charts of the Week: Balanced Policy, Resilient Data and AI Narratives
by:Andrew Cates


