 Global| Jun 06 2011
More Good News For German Economy: E.Coli a Cloud on the Horizon?
Summary
German new orders for manufacturing rose 2.4% in April to 121.5 (2005=100) from 119.0 in March. They almost made up for the 2.5% decline in March and are now only 6% below the pre recession peak of 129.5 reached in November, 2007. [...]
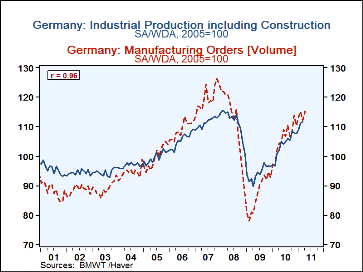
German new orders for manufacturing rose 2.4% in April to 121.5 (2005=100) from 119.0 in March. They almost made up for the 2.5% decline in March and are now only 6% below the pre recession peak of 129.5 reached in November, 2007. (Even though seasonally adjusted, German new orders tend to be up one month and down the next.) New Orders are a good indicator of Industrial Production, as can be seen in first chart, which shows a correlation between the two series of .96. The Industrial Production for April is due to be released tomorrow. The high correlation with orders suggests that it should show a significant rise in April from March.
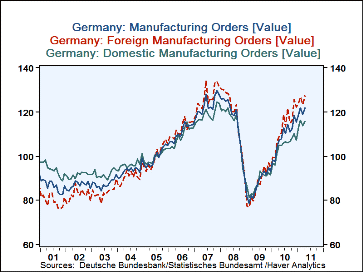
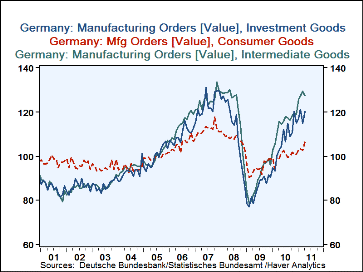
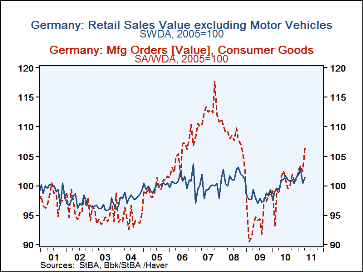
Domestic orders rose 1.7% and foreign, 2.9%, as shown in the second chart. Orders for investment goods rose 4.9% and orders for consumer goods rose 3.9% while orders for intermediate goods declined 1.4%. Over the recovery period, orders for intermediate and investment goods have been much stronger than those for consumer goods, as can be seen in the third chart. Perhaps the relatively slow increase in new consumer goods orders has been due to the recent sluggish trend in retail sales, shown in the fourth chart. Except for the run up in orders for consumer goods and subsequent bust during the period from late 2006 to early 2009 orders for consumer goods and retail sales followed the same general trend. Retail sales, reported today, increased 0.9% in April.
The good news refers mostly to the conditions one or two months ago. Currently, it is the E.Coli outbreak in Germany that is taking center stage. While it is too early to attempt an estimate of the economic impact, it may be useful to recall the SARS, (Severe Acute Respiratory Syndrome) outbreak of 2003 as a "worst possible outcome." That pandemic affected some 8,500 individuals, principally in China, Hong Kong, Taiwan and Singapore where deaths were respectively, 433, 291, 81 and 31. The epidemic seriously affected tourism and travel and had a noticeable effect on gross domestic product in the second quarter of 2003, as can be seen in the fifth chart. So far the current outbreak has affected some 2,000 individuals and resulted in 23 deaths. Its economic impact is being felt largely in the agricultural sector.
| Germany (2005=100) | Apr-11 | Mar-11 | Apr-10 | M/M %Chg | Y/Y %Chg | 2010 | 2009 | 2008 |
|---|---|---|---|---|---|---|---|---|
| New Orders Value | 121.8 | 119.0 | 107.1 | 2.35 | 13.73 | 109.1 | 87.5 | 115.5 |
| Domestic | 115.7 | 113.8 | 105.0 | 1.67 | 10.19 | 104.5 | 88.1 | 113.0 |
| Foreign | 127.2 | 123.6 | 109.0 | 2.96 | 6.70 | 113.0 | 87.1 | 117.7 |
| Investment Goods | 120.4 | 114.8 | 102.7 | 4.88 | 17.23 | 106.9 | 85.2 | 112.9 |
| Consumer Goods | 106.4 | 102.4 | 98.6 | 3.91 | 7.91 | 99.2 | 94.8 | 108.0 |
| Intermediate Goods | 127.4 | 129.2 | 115.8 | -1.39 | 10.02 | 114.4 | 89.4 | 121.2 |
| Manufacturing Sales | 117.9 | 117.4 | 103.0 | 0.43 | 14.47 | 106.2 | 93.9 | 117.4 |
| Retail Trade Value | 101.4 | 100.5 | 99.3 | 0.90 | 2.11 | 100.3 | 98.0 | 101.6 |
More Economy in Brief
 Global| Feb 05 2026
Charts of the Week: Balanced Policy, Resilient Data and AI Narratives
by:Andrew Cates


