 Global| Jun 14 2010
More Industrial Production Data: Japan, Hong Kong And The Euro Area
Summary
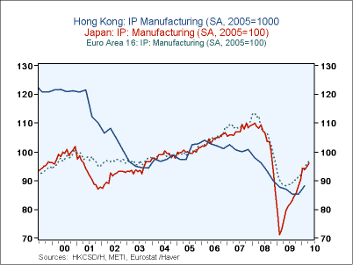
Industrial production in most countries has shown improvement in the first few months of this year. Today data for the first quarter for Hong Kong and for April of this year for Japan and the entire Euro Area were released. The data [...]
 Industrial
production in most countries has shown improvement in the first few
months of this year. Today data for the first quarter for
Hong Kong and for April of this year for Japan and the entire Euro Area
were released. The data are shown in the attached
chart. For comparability, the original index for Hong Kong
based on 2008=100 was changed to 2005=100, the base of the other two
series, using the "advanced function" in DLX. In addition since the
data for Hong Kong are for the manufacturing sector only, we have used
data for the manufacturing data for Japan and the Euro Area instead of
their total industrial production figures that includes mining,
quarrying, electricity, gas and water supply and construction.
Of the two countries and the Euro Area, manufacturing production in Japan was the first to decline and has experienced the sharpest decline and recovery. In April, manufacturing production in Japan was 95.9 (2005-100) 34.7% above the low point of 71.2 in February, 2009. The comparable figures for the Euro Area are 9.7% and 88.2 in May 2009. The data for Hong Kong are quarterly, and therefore, somewhat less volatile than the monthly figures. By the first quarter of this year, manufacturing production in Hong Kong was 88.1 (2005=100) or 3.3% above the low of 85.3 reached in the 3rd quarter of 2009.
| IP: Manufacturing (SA, 2005=100) | Apr 10 |
Mar 10 |
Feb 10 |
Jan 10 |
Dec 09 |
Nov 09 |
Oct 09 |
Sep 09 |
Aug 09 |
|---|---|---|---|---|---|---|---|---|---|
| Japan | 95.9 | 94.7 | 93.6 | 94.2 | 90.3 | 88.0 | 85.8 | 84.4 | 82.9 |
| Euro Area | 96.6 | 96.1 | 94.3 | 93.6 | 91.8 | 91.5 | 90.1 | 90.1 | 89.1 |
| Q1 10 | Q4 09 | Q3 09 | |||||||
| Hong Kong | -- | -- | 88.1 | -- | -- | 85.4 | -- | -- | 85.3 |
More Economy in Brief
 Global| Feb 05 2026
Charts of the Week: Balanced Policy, Resilient Data and AI Narratives
by:Andrew Cates


