 Global| Sep 30 2008
More Signs of Recessions in Japan
Summary
Japanese gross domestic product declined at an annual rate of 2.96% in the second quarter of this year after having risen at an annual rate of 2.76% in the first quarter. Monthly data released recently for the third quarter suggest [...]
 Japanese gross domestic product declined at an annual rate of
2.96% in the second quarter of this year after having risen at an
annual rate of 2.76% in the first quarter. Monthly data released
recently for the third quarter suggest another down quarter.
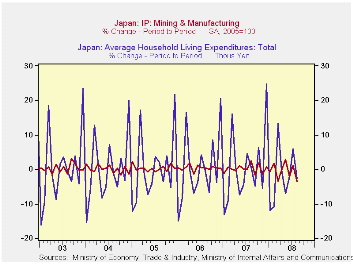
After rising 1.3% in July, Japanese industrial production declined 3.5% in August, the fastest decline in five years. The Family Income and Expenditure Survey revealed that households reduced spending in August by 4.7%. The household expenditure series, however, is extremely volatile so the year- over- year changes are, perhaps, better indicators of the trend than the month- to- month changes. The month- to- month changes in the household expenditures and in industrial production are shown in the first chart and the year- over- year changes in the second chart.
Another ominous sign is the rise in unemployment rate in August. It is now 4.2%, the highest level since June 2006 as can be seen in the third chart.


| JAPAN | Aug 08 | Jun 08 | Jul 07 | M/M % chg | Y/Y % chg | 2007 | 2006 | 2005 |
|---|---|---|---|---|---|---|---|---|
| Industrial Production (2005=100) | 104.5 | 108.3 | 109.7 | -3.51 | -4.74 | 107.1 | 104.3 | 100.1 |
| Household Expenditures (Thous Yen) | 291.3 | 299.3 | 294.0 | -2.69 | -0.94 | 297.1 | 295.3 | 300.9 |
| Unemployment (10,000 persons) | 275 | 264 | 252 | 4.17 | 91.3 | 256 | 275 | 294 |
| Unemployment Rate (%) | 4.2 | 4.0 | 3.8 | 0.2* | 0.4* | 3.9 | 4.1 | 4.4 |
| * Percentage point change | ||||||||


