 Global| Nov 09 2005
Mortgage Applications Rose
by:Tom Moeller
|in:Economy in Brief
Summary
Last week, the total number of mortgage applications recovered about half of the prior period's decline with a 2.3% rise according to the Mortgage Bankers Association. The modest increase followed weekly declines from June to October [...]
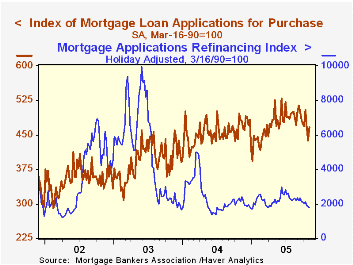
Last week, the total number of mortgage applications recovered about half of the prior period's decline with a 2.3% rise according to the Mortgage Bankers Association. The modest increase followed weekly declines from June to October and left applications 17.5% below the monthly peak during June.
Purchase applications rose for just the second week in the last eight and the 6.4% rise reversed nearly all of the prior week's decline. Nevertheless purchase applications remained 6.0% below the July peak. During the last ten years there has been a 49% correlation between the y/y change in purchase applications and the change in new plus existing single family home sales.
Applications to refinance continued down another 3.4% leaving the level of refi's nearly one third below the recent peak in June and 79.5% below the monthly high during 2003.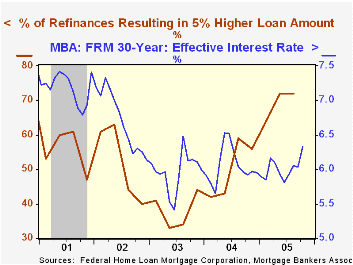
The Federal Home Loan Mortgage Corporation reported that 72% of refinances resulted in a 5% higher loan amount during 3Q '05, nearly double the percentage during 2003.
The effective interest rate on a conventional 30-year mortgage rose to 6.58% from 6.46% the prior week while the effective rate on a 15-year mortgage rose to 6.19%, the highest since July 2002. The interest rates on 15 and 30 year mortgages are closely correlated (>90%) with the rate on 10 year Treasury securities.
The Mortgage Bankers Association surveys between 20 to 35 of the top lenders in the U.S. housing industry to derive its refinance, purchase and market indexes. The weekly survey accounts for more than 40% of all applications processed each week by mortgage lenders. Visit the Mortgage Bankers Association site here.
A rising housing tide from the Federal Reserve Bank of Minneapolis can be found here.
| MBA Mortgage Applications (3/16/90=100) | 11/04/05 | 10/28/05 | Y/Y | 2004 | 2003 | 2002 |
|---|---|---|---|---|---|---|
| Total Market Index | 661.3 | 646.7 | -9.1% | 735.1 | 1,067.9 | 799.7 |
| Purchase | 465.7 | 437.6 | -3.6% | 454.5 | 395.1 | 354.7 |
| Refinancing | 1,798.8 | 1,862.8 | -16.3% | 2,366.8 | 4,981.8 | 3,388.0 |
by Carol Stone November 9, 2005
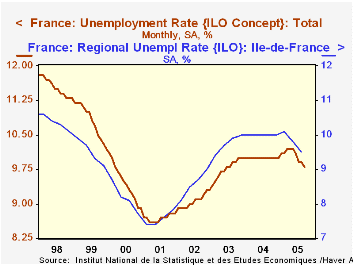
The riots in France are widely believed to be linked to unemployment conditions, particularly among young people from North African immigrant families. As we discussed here September 30, national unemployment stands at just under 10%, and the rate for workers under 25 is more than twice this, at about 23%. This morning, the French Government statistical agency INSEE reported regional unemployment rates, which we carry in the FRANCE database. These cover the total labor force and are not broken down by age-group. These, along with September's monthly national data reported ten days ago, indicate that rates have been decreasing, now since June.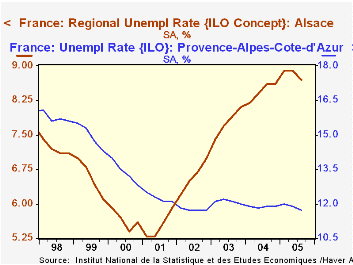
In the accompanying charts and table, we highlight "departments" that the New York Times reports today contain cities on a list authorized by the central police to impose a curfew, that is, where the violence is deemed to be greatest. These include Paris, Nice, Marseille, Dijon, Toulouse, Strasbourg, Nancy, Rouen, Avignon. Ironically, as seen in the exhibits, unemployment rates in the relevant departments had started to ease in Q3. The national rate fell from 10.1% to 9.8%, and every department we show here was down by at least 0.1% on the quarter. Still, these decreases are a very recent development, with the longer runs of these series still generally headed upward. Only in Provence, in the South, is unemployment even steady with its level three years ago. Another fact of irony is the situation in Alsace, with one of the lowest unemployment levels in the country; it is also the locale with the largest increase, from just 6.6% on average in 2002 to 8.7% in Q3 2005. So conditions of relative prosperity there eroded markedly, at least through the middle of this year.
It's clearly too soon to see the effect of the disturbances on any other French economic data, but a final irony of course is that the situation is likely to be dampening activity, just when the worst of the unemployment conditions might have been starting to stabilize on their own.
| France & Selected Departments: SA, % | Q3 2005 | Q2 2005 | Q3 2004 | 2004 | 2003 | 2002 |
|---|---|---|---|---|---|---|
| France: Total | 9.8 | 10.1 | 10.0 | 10.0 | 9.8 | 9.1 |
| Ile-de-France (Paris) | 13.3 | 13.4 | 13.2 | 13.1 | 12.7 | 12.3 |
| Bourgogne (Dijon) | 8.5 | 8.8 | 8.7 | 8.7 | 8.6 | 7.9 |
| Haut-Normandie (Rouen) | 10.8 | 11.0 | 11.0 | 10.9 | 10.6 | 10.1 |
| Alsace (Strasbourg) | 8.7 | 8.9 | 8.6 | 8.5 | 7.8 | 6.6 |
| Pyrenees (Toulouse) | 9.8 | 9.9 | 9.9 | 9.9 | 9.9 | 9.5 |
| Provence (Avignon, Nice, Marseilles) | 11.7 | 11.9 | 11.9 | 11.9 | 12.1 | 11.7 |

Tom Moeller
AuthorMore in Author Profile »Prior to joining Haver Analytics in 2000, Mr. Moeller worked as the Economist at Chancellor Capital Management from 1985 to 1999. There, he developed comprehensive economic forecasts and interpreted economic data for equity and fixed income portfolio managers. Also at Chancellor, Mr. Moeller worked as an equity analyst and was responsible for researching and rating companies in the economically sensitive automobile and housing industries for investment in Chancellor’s equity portfolio. Prior to joining Chancellor, Mr. Moeller was an Economist at Citibank from 1979 to 1984. He also analyzed pricing behavior in the metals industry for the Council on Wage and Price Stability in Washington, D.C. In 1999, Mr. Moeller received the award for most accurate forecast from the Forecasters' Club of New York. From 1990 to 1992 he was President of the New York Association for Business Economists. Mr. Moeller earned an M.B.A. in Finance from Fordham University, where he graduated in 1987. He holds a Bachelor of Arts in Economics from George Washington University.
More Economy in Brief

 Global| Feb 05 2026
Charts of the Week: Balanced Policy, Resilient Data and AI Narratives
by:Andrew Cates

