 Global| Oct 06 2008
No Place To Hide: Stock Markets In Different Parts Of The World Increasingly Move Together
Summary
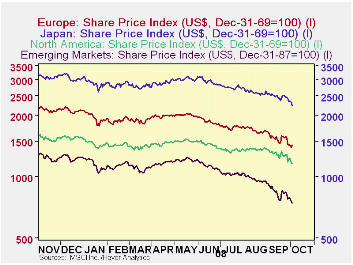
Stock prices in Europe, Japan and the emerging markets appear to have moved in lock step with those in North America over the past year as shown in the first chart that plots Morgan Stanley Capital International (MSCI) daily stock [...]
 Stock prices in Europe, Japan and the emerging markets
appear to have moved in lock step with those in North America over the
past year as shown in the first chart that plots Morgan Stanley Capital
International (MSCI) daily stock prices. This is in contrast
to earlier periods when it was possible to reduce risk by geographic
diversification, particularly into the emerging
markets.
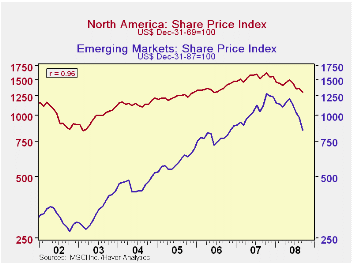
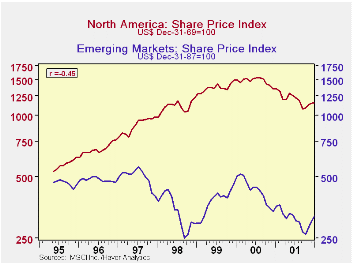
When emerging markets began to be a significant factor in the universe of world's stock markets, their stock prices tended to move independently of those in the developed markets. From May 1995 to December, 2001, the correlation between the stock prices of the emerging markets and those of North America, for example, was .46 as shown in the second chart. The R2 = .21, means that only 21% of the change in one market affected the other market. Since then the prices of the two stock markets have tended to move together. The third chart shows that the correlation between the two series from January 2002 to the present has risen to .96, with an R2 = .92, indicating that 92% of the change in one markets affected the other market. These charts are based on the monthly MSCI data. (Charts showing the prices of emerging markets with other developed markets, such as Japan and Europe show similar differences in the two periods.)


| MSCI
STOCK PRICE INDEXES ( Month to Month % Change) |
Sep 08 | Aug 08 | Jul 08 | Jun 08 | May 08 |
|---|---|---|---|---|---|
| Emerging Markets | -13.3 | -5.7 | -8.9 | -6.2 | 3.8 |
| United States | -5.1 | 1.0 | -6.4 | -3.7 | 2.9 |
| Europe | -8.4 | -3.2 | -6.6 | -6.2 | 1.3 |
| Japan | -4.4 | -5.5 | -6.8 | -2.0 | 4.3 |
More Economy in Brief
 Global| Feb 05 2026
Charts of the Week: Balanced Policy, Resilient Data and AI Narratives
by:Andrew Cates


