 Global| Sep 24 2007
No Surprise:Manufacturing New Orders for the Total Euro Area Decline
Summary
The July weakness in manufacturing new orders for the entire Euro Area is hardly a surprise. Earlier releases of data on new orders for several of the member countries were pointing in this direction. The index of new orders for [...]

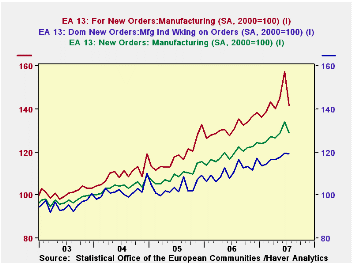
The July weakness in manufacturing new orders for the entire Euro Area is hardly a surprise. Earlier releases of data on new orders for several of the member countries were pointing in this direction. The index of new orders for manufacturing in the total Euro Area declined 4.1% from 134.2 (2000=100) in June to 128.8 in July. Most of the decline took place in foreign orders. Domestic orders declined 0.2% while foreign orders fell by 10.0%. Total, domestic and foreign new orders are shown in the first chart.
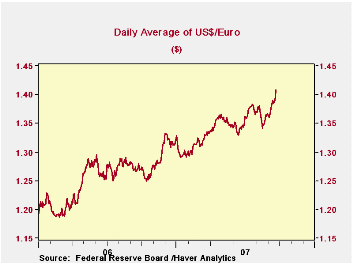
The rise in the euro has undoubtedly affected foreign orders. From the end of 2005 to the end of July of this year, the euro has risen 16% against the dollar. It has since risen a further 3% and reached an all time high of $1.409 last Thursday. The daily values of the euro in US dollars since the end of 2005 are shown in the second chart.
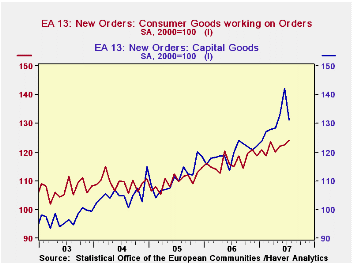
New orders for consumer goods actually rose 1.1% in July from 122.6 to 124.0. But this increase was more than offset by an 8% decline in orders for capital goods. Data on consumer and capital goods orders are shown in the third chart.


| EURO AREA INDEX OF MANUFACTURING NEW ORDERS (2000=100) | Jul 07 | Jun 07 | Jul 06 | M/M Chg | Y/Y Chg | 2006 | 2005 | 2004 |
|---|---|---|---|---|---|---|---|---|
| Total | 128.8 | 134.2 | 119.2 | -4.1 | 8.0 | 119.2 | 109.2 | 104.0 |
| Domestic | 119.3 | 119.5 | 110.7 | -0.2 | 7.8 | 111.1 | 103.6 | 101.8 |
| Foreign | 140.6 | 157.3 | 130.5 | -10.0 | 8.4 | 131.5 | 118.3 | 109.8 |
| Capital Goods Orders | 131.0 | 142.3 | 119.8 | -8.0 | 9.4 | 119.5 | 111.0 | 105.2 |
| Consumer Goods Orders | 124.0 | 122.6 | 115.0 | 1.1 | 7.8 | 116.7 | 110.0 | 109.3 |
More Economy in Brief
 Global| Feb 05 2026
Charts of the Week: Balanced Policy, Resilient Data and AI Narratives
by:Andrew Cates


