Global| Nov 14 2005
October U.S. Budget Deficit Down Y/Y
by:Tom Moeller
|in:Economy in Brief
Summary
The U.S. federal government budget deficit continued lower during the opening month of FY06. The deficit of $47.2B fell 17.6% versus last October, about the same rate of decline as during FY05. As a percentage of GDP the deficit fell [...]
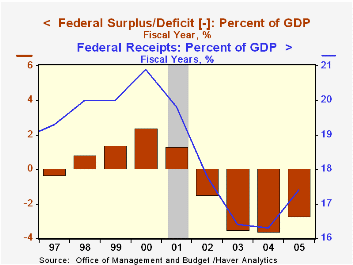
The U.S. federal government budget deficit continued lower during the opening month of FY06. The deficit of $47.2B fell 17.6% versus last October, about the same rate of decline as during FY05.
As a percentage of GDP the deficit fell to 2.6% last fiscal year versus 3.6% in FY04. The latest projection from the Congressional Budget Office is for a further decline to 2.4% in FY06.
Net receipt continued firm 9.2% y/y rate last month, powered by 16.0% growth in individual income tax receipts (44% of total receipts). That growth made up for an October shortfall in corporate income taxes (10% of total receipts) which left them 20.5% last October.
Total receipts accounted for 17.5% of GDP last fiscal year, up from 16.3% the prior year but down from 18.4% during the 1990s.
The improved job market continued to lift employment taxes (36% of total receipts) 6.4% y/y, a slowdown versus 8.8% growth during all of FY 2005 which was the strongest increase since 1988.
U.S. net outlays grew 1.3% y/y last month despite a 28.0% gain in defense (19% of total outlays). Medicare spending (12% of total outlays) fell 11.4% y/y but spending on social security (21% of total outlays) rose 5.7%. Spending on health programs (10% of the total) rose 3.5% while spending on education & training (4% of the total) fell 5.0% y/y after double digit gains during three of the last four fiscal years. Interest expense (8% of the total) grew 13.0% with higher interest rates after a 14.9% gain last fiscal year.
The latest projections from the US Congressional Budget Office are available here.
| US Government Finance | Oct | Sept | Y/Y | FY 2005 | FY 2004 | FY 2003 |
|---|---|---|---|---|---|---|
| Budget Balance | $-47.2B | $35.7B | $-57.3B (10/04) | $-318.6B | $-412.1B | $-377.6B |
| Net Revenues | $149.5B | $151.6B | 9.2% | 14.6% | 5.5% | -3.8% |
| Net Outlays | $196.7B | $216.0B | 1.3% | 7.9% | 6.1% | 7.4% |

Tom Moeller
AuthorMore in Author Profile »Prior to joining Haver Analytics in 2000, Mr. Moeller worked as the Economist at Chancellor Capital Management from 1985 to 1999. There, he developed comprehensive economic forecasts and interpreted economic data for equity and fixed income portfolio managers. Also at Chancellor, Mr. Moeller worked as an equity analyst and was responsible for researching and rating companies in the economically sensitive automobile and housing industries for investment in Chancellor’s equity portfolio. Prior to joining Chancellor, Mr. Moeller was an Economist at Citibank from 1979 to 1984. He also analyzed pricing behavior in the metals industry for the Council on Wage and Price Stability in Washington, D.C. In 1999, Mr. Moeller received the award for most accurate forecast from the Forecasters' Club of New York. From 1990 to 1992 he was President of the New York Association for Business Economists. Mr. Moeller earned an M.B.A. in Finance from Fordham University, where he graduated in 1987. He holds a Bachelor of Arts in Economics from George Washington University.
More Economy in Brief
 Global| Feb 05 2026
Charts of the Week: Balanced Policy, Resilient Data and AI Narratives
by:Andrew Cates