 Global| Nov 04 2005
October U.S. Payrolls Soft
by:Tom Moeller
|in:Economy in Brief
Summary
Non-farm payrolls rose 56,000 last month following a revised 8,000 worker decline in September, initially reported at down 35,000. In addition, the August rise in payrolls was revised lower to 148,000 from 211,000 reported earlier. [...]
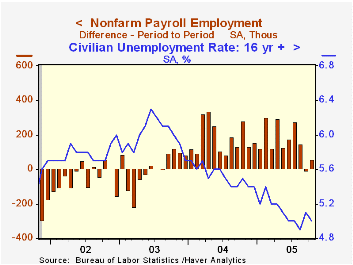
Non-farm payrolls rose 56,000 last month following a revised 8,000 worker decline in September, initially reported at down 35,000. In addition, the August rise in payrolls was revised lower to 148,000 from 211,000 reported earlier. Consensus expectations had been for a larger 122,000 increase in October.
The Bureau of Labor Statistics indicated that the weaker-than-expected October number was due to softness in the labor market outside of hurricane-affected regions.
Construction employment rose 33,000 (3.8% y/y), about twice the average gain during the prior four months. October's strength at least partly reflected rebuilding following Hurricane Katrina.
Factory sector payrolls increased 12,000 following a little revised 28,000 worker decline in September. Transportation equipment jobs increased 22,000, largely due to the return of 18,000 striking workers in the aerospace industry.
Payrolls in private service producing industries fell the same 3,000 (+1.7% y/y) as during September which was revised from -67,000. Retail jobs fell 5,400 (+0.7% y/y) and the September decline was lessened to 58,000, initially spotted at -88,000. The leisure & hospitality industries shed another 18,000 (+1.6% y/y) after a 63,000 decline in September, revised from -80,000.
Professional & business services jobs rose 12,000 (2.7% y/y) and financial sector jobs rose 22,000 (2.4% y/y).Education & health services jobs increased 11,000 (2.2% y/y).
Average hourly earnings rose 0.5%, more than double expectations. Factory sector earnings rose 0.7% (2.6% y/y) and private service sector earnings jumped 0.9% (3.5% y/y).
From the household survey, the unemployment rate fell to 5.0% versus expected stability at 5.1%. Employment jumped 214,000 (2.0% y/y) and the labor force fell 14,000 (+1.5% y/y).
| Employment | Oct | Sept | Y/Y | 2004 | 2003 | 2002 |
|---|---|---|---|---|---|---|
| Payroll Employment | 56,000 | -8,000 | 1.4% | 1.1% | -0.3% | -1.1% |
| Manufacturing | 12,000 | -28,000 | -0.7% | -1.2% | -4.9% | -7.2% |
| Average Weekly Hours | 33.8 | 33.8 | 33.8 | 33.7 | 33.7 | 33.8 |
| Average Hourly Earnings | 0.5% | 0.1% | 2.9% | 2.1% | 2.7% | 2.9% |
| Unemployment Rate | 5.0% | 5.1% | 5.5% | 5.5% | 6.0% | 5.8% |
by Carol Stone November 4, 2005
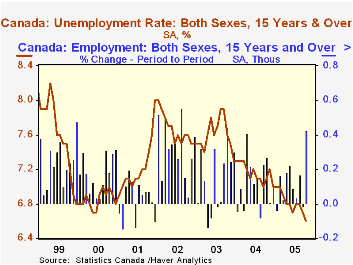
After last month's somewhat counter-intuitive labor market report in Canada, October data righted the relationships of jobs -- up -- and unemployment -- down, showing an improved picture overall.
The number of workers employed jumped 68,700 after easing 2,300 in September. There were notable gains in several industry sectors: trade, finance, professional and technical services, education, and health and social services. Those in trade and finance were outsized and served to offset declines in previous months. Others are less defined, but indicative of generally rising trends. In the goods producing sector, total jobs were down 3,200; manufacturing, down 7,700, extended an irregular downtrend that began in early 2003, and construction fell 4,900.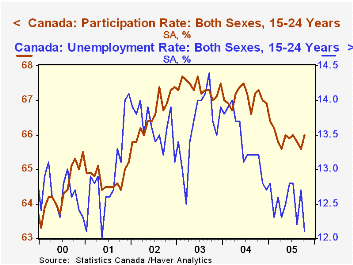
The unemployment rate declined further in October, to 6.6% from 6.7% in September and two months at 6.8%. As we indicated last month, these are generation-low unemployment rates. The last time unemployment in Canada for all workers 15 years old and over was 6.6% or below was in April 1975, more than 30 years ago. Many Canadian labor market gauges highlight a middle age range of 15-64 years old, that is, omitting older workers. This unemployment rate remained at 6.8% in October, basically where it has been for the last seven months. Last month, we emphasized that lower unemployment didn't necessarily imply tight labor markets because participation was declining. There was a slight improvement in this situation in October, with the overall rate rising to 67.2% from September's 67.1%; the rate for 15-64 year olds, shown in the table below, also ticked up, from 77.7% to 77.8%.
We also cited last time the weakness in employment of young workers, but in October jobs for 15-24 year olds increased 32,000, contributing to a rise in their participation rate from 65.6% to 66.0%. Their unemployment rate dropped from 12.7% to 12.1%. Clearly month-to-month movements in these figures, particularly around the beginning of a school year, may not tell much fundamental about employment conditions generally, but for these young people, we can point to progress in reducing their unemployment from 14.0% early in 2004 and some hint of stabilization in their participation rates at about 66% throughout 2005. The number of jobs they hold is just about even with a year ago.
| CanadaAge 15 and over | Mo/Mo Change, 000sYr/Yr % Oct | December/December|||||
|---|---|---|---|---|---|---|
| Oct 2005 | Sept 2005 | 2004 | 2003 | 2002 | ||
| Employment | 68.7 | -2.3 | 1.2% | 1.5% | 1.9% | 4.0% |
| Goods- Producing | -3.2 | -14.5 | 0.4% | 2.0% | -0.5% | 6.3% |
| Service- Producing | 71.9 | 12.2 | 1.5% | 1.2% | 2.6% | 3.1% |
| Labor Force | 52.7 | -7.4 | 0.7% | 1.1% | 1.6% | 3.2% |
| Ages 15-64 | Oct 2005 | Sept 2005 | Oct 2004 | Annual Average | ||
| Unemployment Rate | 6.8% | 6.8% | 7.1% | 7.2% | 7.7% | 7.7% |
| Participation Rate | 77.8% | 77.7% | 78.1% | 78.2% | 78.1% | 77.4% |

Tom Moeller
AuthorMore in Author Profile »Prior to joining Haver Analytics in 2000, Mr. Moeller worked as the Economist at Chancellor Capital Management from 1985 to 1999. There, he developed comprehensive economic forecasts and interpreted economic data for equity and fixed income portfolio managers. Also at Chancellor, Mr. Moeller worked as an equity analyst and was responsible for researching and rating companies in the economically sensitive automobile and housing industries for investment in Chancellor’s equity portfolio. Prior to joining Chancellor, Mr. Moeller was an Economist at Citibank from 1979 to 1984. He also analyzed pricing behavior in the metals industry for the Council on Wage and Price Stability in Washington, D.C. In 1999, Mr. Moeller received the award for most accurate forecast from the Forecasters' Club of New York. From 1990 to 1992 he was President of the New York Association for Business Economists. Mr. Moeller earned an M.B.A. in Finance from Fordham University, where he graduated in 1987. He holds a Bachelor of Arts in Economics from George Washington University.
More Economy in Brief

 Global| Feb 05 2026
Charts of the Week: Balanced Policy, Resilient Data and AI Narratives
by:Andrew Cates

