Global| Nov 04 2005
October U.S. Payrolls Soft
by:Tom Moeller
|in:Economy in Brief
Summary
Non-farm payrolls rose 56,000 last month following a revised 8,000 worker decline in September, initially reported at down 35,000. In addition, the August rise in payrolls was revised lower to 148,000 from 211,000 reported earlier. [...]
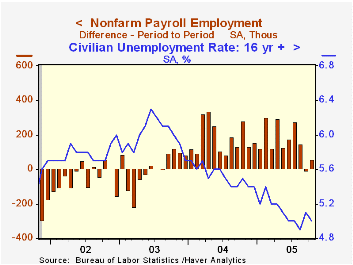
Non-farm payrolls rose 56,000 last month following a revised 8,000 worker decline in September, initially reported at down 35,000. In addition, the August rise in payrolls was revised lower to 148,000 from 211,000 reported earlier. Consensus expectations had been for a larger 122,000 increase in October.
The Bureau of Labor Statistics indicated that the weaker-than-expected October number was due to softness in the labor market outside of hurricane-affected regions.
Construction employment rose 33,000 (3.8% y/y), about twice the average gain during the prior four months. October's strength at least partly reflected rebuilding following Hurricane Katrina.
Factory sector payrolls increased 12,000 following a little revised 28,000 worker decline in September. Transportation equipment jobs increased 22,000, largely due to the return of 18,000 striking workers in the aerospace industry.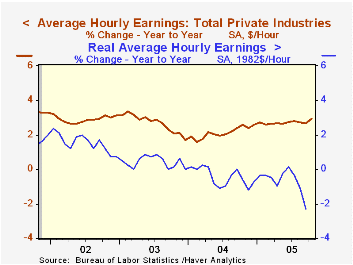
Payrolls in private service producing industries fell the same 3,000 (+1.7% y/y) as during September which was revised from -67,000. Retail jobs fell 5,400 (+0.7% y/y) and the September decline was lessened to 58,000, initially spotted at -88,000. The leisure & hospitality industries shed another 18,000 (+1.6% y/y) after a 63,000 decline in September, revised from -80,000.
Professional & business services jobs rose 12,000 (2.7% y/y) and financial sector jobs rose 22,000 (2.4% y/y).Education & health services jobs increased 11,000 (2.2% y/y).
Average hourly earnings rose 0.5%, more than double expectations. Factory sector earnings rose 0.7% (2.6% y/y) and private service sector earnings jumped 0.9% (3.5% y/y).
From the household survey, the unemployment rate fell to 5.0% versus expected stability at 5.1%. Employment jumped 214,000 (2.0% y/y) and the labor force fell 14,000 (+1.5% y/y).
| Employment | Oct | Sept | Y/Y | 2004 | 2003 | 2002 |
|---|---|---|---|---|---|---|
| Payroll Employment | 56,000 | -8,000 | 1.4% | 1.1% | -0.3% | -1.1% |
| Manufacturing | 12,000 | -28,000 | -0.7% | -1.2% | -4.9% | -7.2% |
| Average Weekly Hours | 33.8 | 33.8 | 33.8 | 33.7 | 33.7 | 33.8 |
| Average Hourly Earnings | 0.5% | 0.1% | 2.9% | 2.1% | 2.7% | 2.9% |
| Unemployment Rate | 5.0% | 5.1% | 5.5% | 5.5% | 6.0% | 5.8% |

Tom Moeller
AuthorMore in Author Profile »Prior to joining Haver Analytics in 2000, Mr. Moeller worked as the Economist at Chancellor Capital Management from 1985 to 1999. There, he developed comprehensive economic forecasts and interpreted economic data for equity and fixed income portfolio managers. Also at Chancellor, Mr. Moeller worked as an equity analyst and was responsible for researching and rating companies in the economically sensitive automobile and housing industries for investment in Chancellor’s equity portfolio. Prior to joining Chancellor, Mr. Moeller was an Economist at Citibank from 1979 to 1984. He also analyzed pricing behavior in the metals industry for the Council on Wage and Price Stability in Washington, D.C. In 1999, Mr. Moeller received the award for most accurate forecast from the Forecasters' Club of New York. From 1990 to 1992 he was President of the New York Association for Business Economists. Mr. Moeller earned an M.B.A. in Finance from Fordham University, where he graduated in 1987. He holds a Bachelor of Arts in Economics from George Washington University.
More Economy in Brief
 Global| Feb 05 2026
Charts of the Week: Balanced Policy, Resilient Data and AI Narratives
by:Andrew Cates