Global| Nov 15 2005
PPI Up Another 0.7%, Core Prices Fell
by:Tom Moeller
|in:Economy in Brief
Summary
The overall Producer Price Index rose another 0.7% last month on top of the 1.9% September spike. The latest by far exceeded Consensus expectations for no change in prices. The strength last month was led by a 12.3% (50.4% y/y) rise [...]
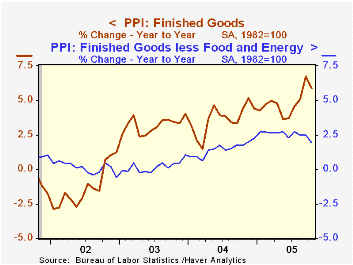
The overall Producer Price Index rose another 0.7% last month on top of the 1.9% September spike. The latest by far exceeded Consensus expectations for no change in prices.
The strength last month was led by a 12.3% (50.4% y/y) rise in home heating oil prices and a 12.7% (38.9% y/y) jump in natural gas which more than offset the 3.3% (+40.3% y/y) decline in gasoline.
Price inflation at the so called "core" level nevertheless eased a bit last month as a 0.3% decline in prices less food & energy reversed all of the prior month's gain. Consensus expectations for a 0.2% increase.
Core finished consumer goods prices fell 0.2% (+2.0% y/y). Durable goods prices dropped 0.9% (+0.2% y/y) led by a 3.0% (-2.1% y/y) decline in passenger car prices as well as weakness in prices for home electronics (-2.0% y/y), carpets (+6.1% y/y) and home appliances (+1.7% y/y). Core consumer nondurable goods prices rose 0.2% (3.5% y/y) for the second consecutive month.
"Spillover" effects from the past strength in oil prices continued to be evident at the earlier stages of processing. Intermediate goods prices jumped 3.0% on top of the 2.5% September surge while core intermediate goods prices repeated their 1.2% spike of the prior month.
Crude energy prices gained 12.4% (69.4% y/y) as natural gas prices soared an unadjusted 20.3% (120.4% y/y). The gain lifted overall crude prices 6.7% though core crude prices reversed some of their September strength with a 1.2% decline. During the last thirty years "core" crude prices have been a fair indicator of industrial sector activity with a 48% correlation between the six month change in core crude prices and the change in factory sector industrial production.
| Producer Price Index | Oct | Sept | Y/Y | 2004 | 2003 | 2002 |
|---|---|---|---|---|---|---|
| Finished Goods | 0.7% | 1.9% | 5.9% | 3.6% | 3.2% | -1.3% |
| Core | -0.3% | 0.3% | 2.0% | 1.5% | 0.2% | 0.1% |
| Intermediate Goods | 3.0% | 2.5% | 10.5% | 6.6% | 4.6% | -1.5% |
| Core | 1.2% | 1.2% | 4.3% | 5.7% | 2.0% | -0.5% |
| Crude Goods | 6.7% | 10.2% | 31.5% | 17.5% | 25.1% | -10.6% |
| Core | -1.2% | 5.3% | 0.9% | 26.6% | 12.4% | 3.8% |
by Tom Moeller November 15, 2005
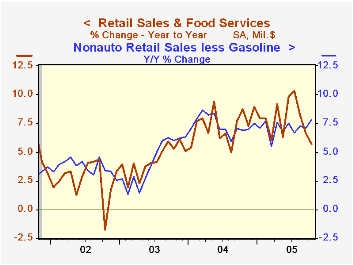
US retail sales dipped 0.1% last month as consumers shifted away from autos and spent elsewhere. The decline followed a little revised 0.3% September gain but compared favorably to Consensus expectations for a 0.6% decline because less autos, retail sales surged 0.9%. That increase was three times the Consensus expectation and the 1.4% September increase was upwardly revised.
Sales at gasoline service stations fell 0.8% after a 5.1% pop in September which was driven by a 16.8% rise in the retail price of gasoline. Gas prices reversed about half of that gain in October and have fallen another 14% so far in November.
Less gasoline, nonauto retail sales rose 1.1% (7.8% y/y) following an upwardly revised 0.8% gain in September. The increase was boosted again by strength in building material sales which jumped 2.1% (13.1% Y/Y) for the third consecutive month of strong gain.
Discretionary spending continued strong as evidenced by a 0.6% (8.2% y/y) rise in furniture & electronics store sales which followed an upwardly revised 1.4% September surge. Sales of nonstore retailers (internet & catalogue) jumped 1.2% (12.2% y/y) and general merchandise store sales rose 1.2% (7.1% y/y). Apparel store sales in October made up for the prior month's dip and ballooned 3.1% (6.5% y/y) even though apparel prices recently have been under pressure (-0.7% y/y thru September).
Today's U.S. Senate Testimony of Ben S. Bernanke is available here.
Oil Prices and Consumer Spending from the Federal Reserve Bank of Richmond is available here.
| Oct | Sept | Y/Y | 2004 | 2003 | 2002 | |
|---|---|---|---|---|---|---|
| Retail Sales & Food Services | -0.1% | 0.3% | 5.7% | 7.3% | 4.3% | 2.5% |
| Excluding Autos | 0.9% | 1.4% | 9.9% | 8.3% | 4.7% | 3.3% |
by Tom Moeller November 15, 2005
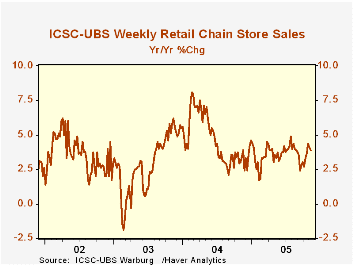
The average US retail price of regular gasoline fell another 8 cents last week to $2.30 per gallon (+16.6 y/y). Yesterday, the spot market price for gasoline was down another 3 cents from the prior week.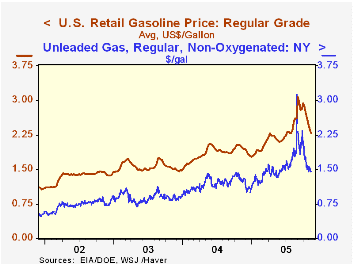
The ICSC-UBS retail chain-store sales index is constructed using the same-store sales (stores open for one year) reported by 78 stores of seven retailers: Dayton Hudson, Federated, Kmart, May, J.C. Penney, Sears and Wal-Mart.
| ICSC-UBS (SA, 1977=100) | 11/12/05 | 11/05/05 | Y/Y | 2004 | 2003 |
|---|---|---|---|---|---|
| Total Weekly Chain Store Sales | 453.3 | 456.1 | 3.9% | 4.6% | 2.9% |
by Tom Moeller November 15, 2005
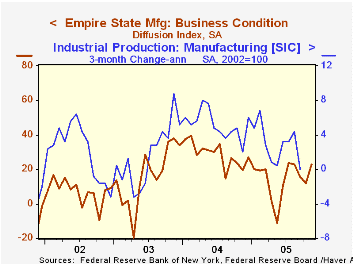
The November Empire State Index of General Business Conditions in New York's manufacturing industries regained all of the prior month's decline and rose 10.7 points to 22.82, the highest level since August. Consensus expectations had been for less of an increase to 15.0.
Since the series' inception in 2001 there has been a close 80% correlation between the index level and the three month change in factory sector production.
Shipments recovered most of the October decline and the employment index jumped to 7.7 points to the highest level in over a year. The new orders index also added a bit to the October 13 point surge while prices paid rose to a record high. 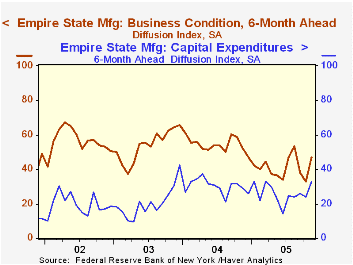
Like the Philadelphia Fed Index of General Business Conditions, the Empire State Business Conditions Index reflects answers to an independent survey question; it is not a weighted combination of the components.
The index of expectations for business conditions in six months recovered sharply. The 14 point jump pulled the index level to its highest since August and expectations for future capital spending jumped. A nine point rise brought the index to the highest level since March.
The Empire State Manufacturing Survey is a monthly survey of manufacturers in New York State conducted by the Federal Reserve Bank of New York. Participants from across the state in a variety of industries respond to a questionnaire and report the change in a variety of indicators from the previous month. Respondents also state the likely direction of these same indicators six months ahead. April 2002 is the first report, although survey data date back to July 2001.
For more on the Empire State Manufacturing Survey, including methodologies and the latest report, click here.
| Empire State Manufacturing Survey | Nov | Oct | Nov '04 | 2004 | 2003 | 2002 |
|---|---|---|---|---|---|---|
| General Business Conditions (diffusion index) | 22.82 | 12.08 | 19.78 | 28.76 | 16.17 | 7.19 |
by Louise Curley November 15, 2005
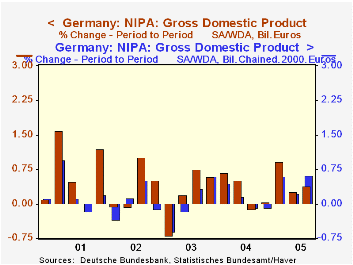
Preliminary data released today show that Germany's Real Gross Domestic Product increased 0.6% in the third quarter, compared with revised increases of 0.6% in the first quarter and 0.2% in the second quarter. The unrevised increases for the first and second quarters were 0.8% and 0.0% respectively. For the three quarters of this year, real GDP is only 0.87% above the three corresponding quarters of 2004, suggesting that growth in 2005 is unlikely to exceed 1.0%. Nominal GDP increased 0.38% in the third quarter, less than the real increase, as the deflator declined 0.24%. This was one of the few times, in the past five years, when the deflator declined, as can be seen in the first chart which shows the quarter-to-quarter growth in Real and Nominal GDP. 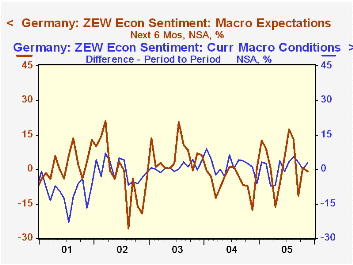
Information on the composition of GDP will not be available until November 22 when the more detailed release is scheduled to appear. However, the Federal Statistical Office offered some qualitative comments in the current release. A strong increase in exports and a considerable rise in capital formation had positive impacts on the quarter-to-quarter growth. Net exports were almost the only cause of year-to-year growth; domestic activity having made little contribution.
The ZEW Center for Economic Research released the results of its survey of institutional investors and financial analysts regarding the current economic situation and the outlook six months ahead. This was one of those rare times when the respondents were less pessimistic about the current situation than they were last month but less positive about the situation six months ahead as can be seem in the second chart. The decline in optimism about the future is generally attributed to doubts that the agreed upon economic program of the Grand Coalition scheduled to take office on November 22 may do little to encourage growth.
| Germany | Q3 05 | Q2 05 | Q3 04 | Q/Q % | Y/Y % | 2004 % | 2003 % | 2002 % |
|---|---|---|---|---|---|---|---|---|
| GDP (Bil. Euros) | 561.05 | 558.90 | 557.16 | 0.38 | 1.61 | 1.88 | 0.84 | 1.55 |
| GDP (Bil 2000 Chained Euros) | 535.02 | 531.73 | 527.02 | 0.62 | 1.36 | 1.09 | -.019 | 0.09 |
| Deflator (2000 =100) | 104.84 | 105.09 | 104.59 | -0.24 | 0.24 | 0.79 | 1.03 | 1.45 |
| ZEW Survey ( Percent Balance) |
Nov 05 | Oct 05 | Nov 04 | M/M Dif | Y/Y Dif | 2004 | 2003 | 2002 |
| Current Situation | -55.2 | -58.0 | -57.8 | 2.8 | 2.6 | -67.7 | 92.6 | 83.3 |
| Situation 6 Months Ahead | 38.7 | 39.4 | 13.9 | -0.7 | 24.8 | 44.6 | 38.4 | 45.3 |

Tom Moeller
AuthorMore in Author Profile »Prior to joining Haver Analytics in 2000, Mr. Moeller worked as the Economist at Chancellor Capital Management from 1985 to 1999. There, he developed comprehensive economic forecasts and interpreted economic data for equity and fixed income portfolio managers. Also at Chancellor, Mr. Moeller worked as an equity analyst and was responsible for researching and rating companies in the economically sensitive automobile and housing industries for investment in Chancellor’s equity portfolio. Prior to joining Chancellor, Mr. Moeller was an Economist at Citibank from 1979 to 1984. He also analyzed pricing behavior in the metals industry for the Council on Wage and Price Stability in Washington, D.C. In 1999, Mr. Moeller received the award for most accurate forecast from the Forecasters' Club of New York. From 1990 to 1992 he was President of the New York Association for Business Economists. Mr. Moeller earned an M.B.A. in Finance from Fordham University, where he graduated in 1987. He holds a Bachelor of Arts in Economics from George Washington University.
More Economy in Brief
 Global| Feb 05 2026
Charts of the Week: Balanced Policy, Resilient Data and AI Narratives
by:Andrew Cates