 Global| Sep 21 2010
Price Of Cotton Soars
Summary
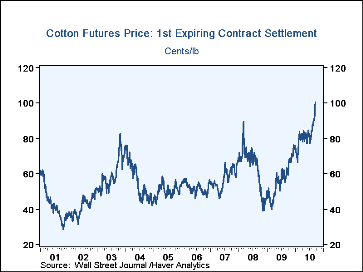
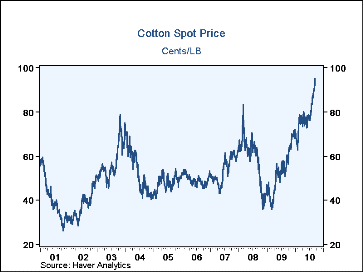
The cash price for a pound of cotton was 95.22 cents last Friday, up 19% since the end of July. By Monday of this week, the futures price was over one dollar up almost 25%. The first two charts show the daily futures and cash prices [...]
The cash price for a pound of cotton was 95.22 cents last Friday, up 19% since the end of July. By Monday of this week, the futures price was over one dollar up almost 25%. The first two charts show the daily futures and cash prices of cotton over the last two years. The rapid run up in cotton prices is due to lower production, largely the result of floods, particularly in Pakistan, but also in China. World consumption continues to increase, as a result stocks are at their lowest level since 1998.
The Haver Data Base, USDA, World Agriculture Statistics, contains a wealth of background information that helps to put the present cotton situation in perspective. Among the data provided are annual production, imports, exports, consumption, beginning and ending stocks, yields, the ratio of stocks to use and the area harvested. Data are provided for practically all agricultural product in practically every country of the world and world totals.
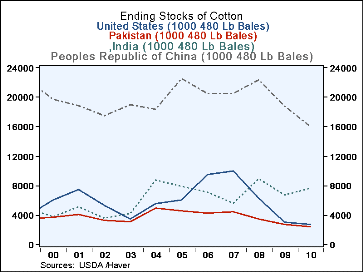
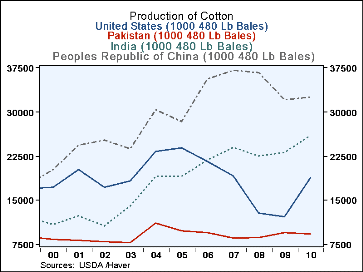
The four largest producers of cotton are China, India, the United States and Pakistan. In the 2010 crop year, China produced 32,500 (1000, 480lb bales), India, 26,000, the U. S., 18,841, and Pakistan, 9,300. as can be seen in the third chart. The four accounted for 74% of world production in that year. China and Pakistan consume most of their production and export very little. India has begun to export some of its production and in 2010 exports amounted to 19% of production. The U. S. is a major exporter and in 2010, exports rose to 82% of production. Production increased significantly in 2010 in India and the U. S.; it was relatively steady in China, and fell in Pakistan. As a result of the reduced production, and in the case of the U. S., increased exports, year end stocks in China, Pakistan and the U. S. are at their lowest levels in the past ten years, as can be seen in the fourth chart. World stocks are 38% below the recent peak reached in 2006.
| Cotton Production(1000 480lb bales) | 2010 | 2009 | 2008 | 2007 | 2006 | 2005 | 2004 | 2003 |
|---|---|---|---|---|---|---|---|---|
| China | 32500 | 32000 | 36700 | 37000 | 35500 | 28400 | 30300 | 23800 |
| India | 26000 | 23200 | 22600 | 24000 | 21800 | 19050 | 19000 | 14000 |
| US | 18841 | 12188 | 12845 | 19207 | 21588 | 23890 | 23520 | 18255 |
| Pakistan | 9300 | 9600 | 8700 | 8600 | 9600 | 9850 | 11138 | 7845 |
| World | 116952 | 101149 | 107136 | 119675 | 121741 | 116478 | 121569 | 96734 |
| Year End Stocks (1000 480lb bales) | ||||||||
| China | 16006 | 18781 | 22366 | 20504 | 20536 | 32531 | 18388 | 18983 |
| India | 7669 | 6669 | 8919 | 5629 | 7129 | 7839 | 8764 | 4186 |
| US | 2700 | 3000 | 6337 | 10051 | 9479 | 6069 | 5495 | 3450 |
| Pakistan | 2473 | 2698 | 3473 | 4473 | 4260 | 4597 | 4945 | 3134 |
| World | 45435 | 46976 | 60439 | 60613 | 62108 | 61841 | 60575 | 48084 |
More Economy in Brief
 Global| Feb 05 2026
Charts of the Week: Balanced Policy, Resilient Data and AI Narratives
by:Andrew Cates


