 Global| Nov 22 2006
Prices Down a Little for Home-Cooked Thanksgiving Dinner
Summary
Is a turkey dinner cheaper this year than last? Maybe so. The BLS's CPI Detail includes some actual prices for a number of basic commodities and foodstuffs in consumers' budgets. Haver carries these in the CPIDATA database. We don't [...]

Is a turkey dinner cheaper this year than last? Maybe so. The BLS's CPI Detail includes some actual prices for a number of basic commodities and foodstuffs in consumers' budgets. Haver carries these in the CPIDATA database. We don't have all the ingredients in a turkey dinner, but there's enough for an idea of the turkey and stuffing along with some potatoes. We've used the CPI for October compared with October a year ago.
The turkey is NOT cheaper, but it's not up very much. The price is $1.149/pound, up a mere 1.2 cents or 1.1%. A 15-pound bird thus costs about 20 cents more. (Since the BLS price is for frozen turkey, we might well have bought it toward the end of October and paid this price.) Potatoes are also up, $0.04 a pound to $0.545; that's 7.9%, and if we use 5 pounds, the increase also amounts to just 20 cents over last year. Prices of bread and flour are also higher, bread by 5.2% and flour by 3.2%.
But all the other ingredients have lower prices. Eggs are off marginally, about a penny a dozen and milk is down 11 cents a gallon. Butter, used widely in this meal to baste the turkey, help mash the potatoes and as an ingredient in the stuffing, is down more noticeably: 20 cents a pound, a 6.4% decrease. We assume we'll use a whole pound. Coffee has declined 9% to $3.14, saving us 15 cents on a half-pound. Finally, we have to have some nice wine with this feast and a typical liter bottle is off 56 cents, saving us $1.12 if we consume two bottles.
So the main course of our Thanksgiving dinner costs $43.50, down from $44.60 in 2005. The BLS data also include apples and sugar, so we could have made an apple pie for dessert. Apples have had a hard season and their cost is 21% ahead of a year ago. Ice cream, for the "a la mode", is up 4%. So if we had too much dessert, we might have eaten up the savings on the main meal. In any event, we probably wouldn't have done any worse than break even on our Thanksgiving dinner expenses compared with 2005. Does that mean we can spend more for Christmas?
[This little section of the CPI data is used frequently for its gas and utility prices, but the food portion is an extensive collection, particularly of various cuts of beef and a number of fruits. The energy data are also available for select metropolitan areas and both the food and energy products are given for the four major Census regions, although not all foods are published for all four regions.]
| Amount | Oct 2006 Price | Value | Oct 2005 Price | Value | Change | |
|---|---|---|---|---|---|---|
| Turkey, Frozen, Whole ($/lb) | 15 | 1.149 | 17.24 | 1.137 | 17.06 | 1.1% |
| Potatoes, White ($/lb) | 5 | 0.545 | 2.72 | 0.505 | 2.52 | 7.9% |
| Bread, White, Pan ($/lb) | 1 | 1.097 | 1.10 | 1.043 | 1.04 | 5.2% |
| Flour, White, All Purpose ($/lb) | 1 1/2 C. | 0.321 | 0.12 | 0.311 | 0.12 | 3.2% |
| Eggs, Grade A, Large ($/dozen) | 2 eggs | 1.257 | 0.21 | 1.264 | 0.21 | -0.6% |
| Milk, Fresh, Whole, Fortified ($/gal) | 1/2 gal. | 3.064 | 1.53 | 3.171 | 1.59 | -3.4% |
| Butter, Salted, Grade AA, Stick ($/lb) | 1 | 2.981 | 2.98 | 3.186 | 3.19 | -6.4% |
| Coffee, 100%, Ground Roast ($/lb) | 1 | 3.138 | 1.57 | 3.447 | 1.72 | -9.0% |
| Table Wine ($/liter) | 2 | 8.013 | 16.03 | 8.575 | 17.15 | -6.6% |
by Tom Moeller November 22, 2006
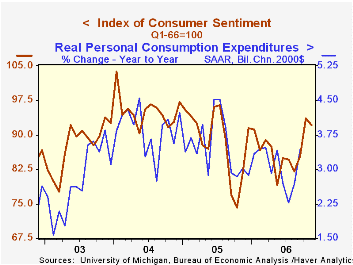
The University of Michigan's full month November reading of consumer sentiment slipped 1.6% from October to 92.1, about as indicated in the preliminary report.
During the last ten years there has been a 76% correlation between the level of consumer sentiment and the y/y change in real consumer spending and during those ten years sentiment has a 68% correlation with the change in nonfarm payrolls.
The reading of current economic conditions fell 1.2% but the current read of personal finances improved 0.8% (+15.5% y/y) as opposed to the a slight decline reported earlier. Perceived buying conditions for large household goods fell further than initially indicated (-0.6% y/y.
Expectations for the economy were unchanged from the preliminary reading and fell 1.9% after the prior month's 8.4% m/m surge.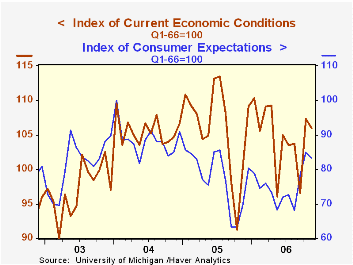
Expected inflation during the next year fell to 3.3%, a bit lower than the earlier read and the lowest since early 2005. Since 1980 there has been an inverse 63% correlation between the level of sentiment and expected inflation during the next year. The five to ten year expected rate of inflation also fell m/m to 3.3%.
Consumers' opinion about gov't economic policy improved even more than initially indicated, by 5.7% (10.8% y/y).
The University of Michigan survey is not seasonally adjusted.The mid-month survey is based on telephone interviews with 250 households nationwide on personal finances and business and buying conditions. The survey is expanded to a total of 500 interviews at month end.
| University of Michigan | November | November (Prelim.) | October | Y/Y | 2005 | 2004 | 2003 |
|---|---|---|---|---|---|---|---|
| Consumer Sentiment | 92.1 | 92.3 | 93.6 | 12.9% | 88.6 | 95.2 | 87.6 |
| Current Conditions | 106.0 | 106.5 | 107.3 | 5.8% | 105.9 | 105.6 | 97.2 |
| Expectations | 83.2 | 83.2 | 84.8 | 19.5% | 77.4 | 88.5 | 81.4 |
by Tom Moeller November 22, 2006
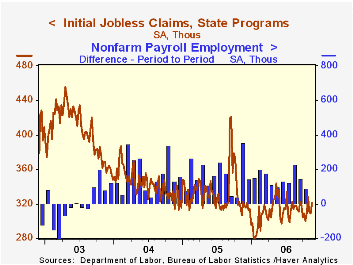
Initial claims for jobless insurance increased 12,000 to 321,000 last week from a slightly revised level during the prior period. Consensus expectations had been for a little changed reading of 310,000 claims.
This latest figure covers the survey period for November nonfarm payrolls and claims rose 21,000 (7.0%) from a depressed level during the October period.
During the last ten years there has been a (negative) 77% correlation between the level of initial claims and the m/m change in nonfarm payroll employment.
The four-week moving average of initial claims rose to 317,000 (0.1% y/y), its highest level in nearly three months. 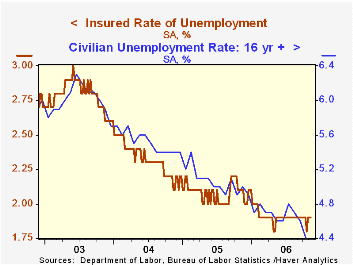
There were no special factors sighted for the latest week's increase in claims. For the prior week, the report indicated that the largest increases in initial claims were in Mississippi (+547), California (+414), Massachusetts (+258), Idaho (+243), and North Carolina (+55), while the largest decreases were in Kentucky (-5,561), Illinois (-3,829), Pennsylvania (-3,645), Georgia (-2,977), and Florida (-2,291).
Continuing claims for unemployment insurance rose 14,000 after a 3,000 worker decline the prior week that slightly weaker than reported initially.
The insured rate of unemployment remained at 1.9%, the average rate since February.
Who's Worrying About Inflation? from the Federal Reserve Bank of St. Louis can be found here.
| Unemployment Insurance (000s) | 11/18/06 | 11/11/06 | Y/Y | 2005 | 2004 | 2003 |
|---|---|---|---|---|---|---|
| Initial Claims | 321 | 309 | -0.3% | 332 | 343 | 403 |
| Continuing Claims | -- | 2,454 | -10.2% | 2,662 | 2,924 | 3,532 |
by Tom Moeller November 22, 2006
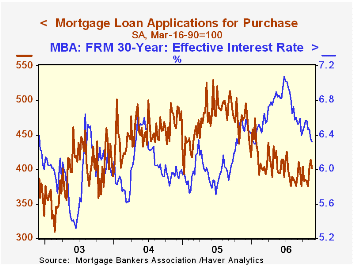
The total number of mortgage applications reversed all of the prior period's gain and fell 2.8% last week, according to the Mortgage Bankers Association. Applications nevertheless remained 6.3% higher this month versus the October average.
Purchase applications fell 2.8% and also reversed the prior week's gain. On average November purchase applications remained 6.3% ahead of the October level. Purchase applications fell 3.6% last month from September on average.
During the last ten years there has been a 58% correlation between the y/y change in purchase applications and the change in new plus existing single family home sales.
The average size of an application to purchase a home rose to $225,800, up from $224,500 averaged last year and $206,800 during 2004.
Applications to refinance reversed most of the prior week's gain with a 4.3% decline but are up 9.7% from the October average which rose 3.5% from September.
The effective interest rate on a conventional 30-year mortgage fell for the second week, slightly to 6.32% and was down from a high last month of 6.57%. The peak for 30 year financing was 7.08% late in June. The rate for 15-year financing, however, increased to 6.12%. The peak for 15 year financing was 6.75% during June. Interest rates on 15 and 30 year mortgages are closely correlated (>90%) with the rate on 10 year Treasury securities.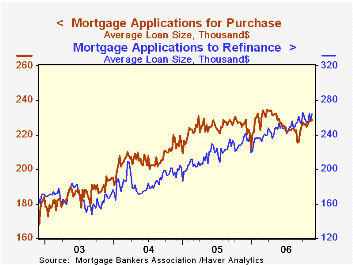
During the last ten years there has been a (negative) 79% correlation between the level of applications for purchase and the effective interest rate on a 30-year mortgage.
The Mortgage Bankers Association surveys between 20 to 35 of the top lenders in the U.S. housing industry to derive its refinance, purchase and market indexes. The weekly survey covers roughly 50% of all U.S. residential mortgage applications processed each week by mortgage banks, commercial banks and thrifts. Visit the Mortgage Bankers Association site here.
Council of Economic Advisors Chairman Ed Lazear's discussion of the updated White House economic forecast is available here.
| MBA Mortgage Applications (3/16/90=100) | 11/10/06 | 11/03/06 | Y/Y | 2005 | 2004 | 2003 |
|---|---|---|---|---|---|---|
| Total Market Index | 623.6 | 647.5 | -1.9% | 708.6 | 735.1 | 1,067.9 |
| Purchase | 401.4 | 412.9 | -15.0% | 470.9 | 454.5 | 395.1 |
| Refinancing | 1,935.3 | 2,022.2 | 22.2% | 2,092.3 | 2,366.8 | 4,981.8 |
Carol Stone, CBE
AuthorMore in Author Profile »Carol Stone, CBE came to Haver Analytics in 2003 following more than 35 years as a financial market economist at major Wall Street financial institutions, most especially Merrill Lynch and Nomura Securities. She had broad experience in analysis and forecasting of flow-of-funds accounts, the federal budget and Federal Reserve operations. At Nomura Securities, among other duties, she developed various indicator forecasting tools and edited a daily global publication produced in London and New York for readers in Tokyo. At Haver Analytics, Carol was a member of the Research Department, aiding database managers with research and documentation efforts, as well as posting commentary on select economic reports. In addition, she conducted Ways-of-the-World, a blog on economic issues for an Episcopal-Church-affiliated website, The Geranium Farm. During her career, Carol served as an officer of the Money Marketeers and the Downtown Economists Club. She had a PhD from NYU's Stern School of Business. She lived in Brooklyn, New York, and had a weekend home on Long Island.
More Economy in Brief
 Global| Feb 05 2026
Charts of the Week: Balanced Policy, Resilient Data and AI Narratives
by:Andrew Cates


