 Global| Dec 20 2005
Production and New Orders in the Euro Zone's Big Three: Germany, France and Italy
Summary
Industrial production in France, Germany and Italy, the three largest countries in the Euro Zone, shows distinctly different trends. While German industrial production has recently shown strength, Italian production has trended [...]

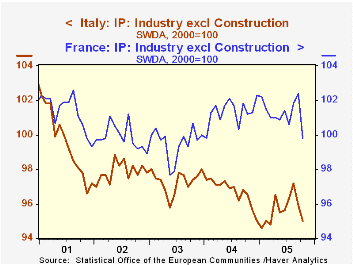
Industrial production in France, Germany and Italy, the three largest countries in the Euro Zone, shows distinctly different trends. While German industrial production has recently shown strength, Italian production has trended downward and French production has shown little trend. In Germany, industrial production increased 1.1% in October from September and was 4.2% above October, 2004. The comparable figures for France were -2.5% and 1.4%; and, for Italy, -0.9% and -1.6%. The sharp drop in French production in October may have been affected by the racial unrest that took place during that time, nevertheless, the trend of production in France has been relatively flat since early 2004. Industrial production in Italy, on the other hand, has been in a declining trend over most of the last five years. Industrial production in France and Italy are shown in the first chart. (The data on industrial production are from Eurostat which insures comparability of data among countries by harmonizing the concepts used by individual countries of the Euro Zone.)
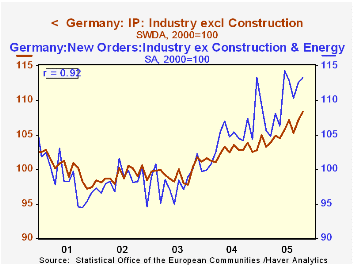
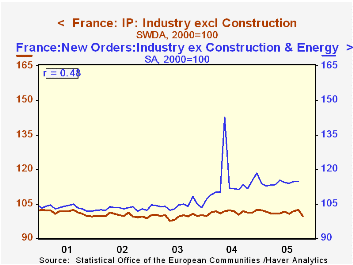
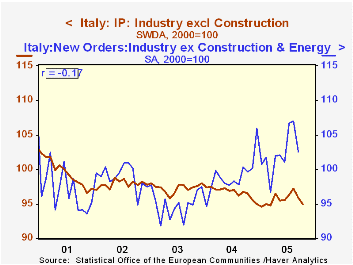
Eurostat data on new orders will not be published until Thursday of this week, but Germany, France and Italy have released their national data on new orders today. In contrast to the trends in industrial production, the trends in new orders in all three countries have generally been rising since mid 2003. German new orders increased by 2.4% in October from September and were almost 10% above October 2004. While the October figures for France and Italy showed declines from September of respectively -2.1% and -1.1%, they were 2.6% and 2.2% respectively above October 2004.
It is not possible to generalize on the relationship between new orders and industrial production on the basis of the experience of these three countries. In the three charts showing new orders and industrial production for each country, the correlations between the two series vary from -0.17 for Italy, 0.47 for France and 0.92 for Germany.
| Oct 05 | Sep 05 | Oct 04 | M/M % | Y/Y % | 2004 | 2003 | 2002 | |
|---|---|---|---|---|---|---|---|---|
| Industrial Production ex Construction ( 2000=100) | ||||||||
| France | 99.8 | 102.4 | 101.2 | -2.54 | -1.38 | 101.3 | 99.5 | 99.9 |
| Italy | 95.0 | 95.9 | 96.5 | -0.94 | -1.55 | 96.7 | 97.3 | 97.9 |
| Germany | 108.3 | 107.1 | 103.9 | 1.12 | 4.23 | 102.5 | 99.5 | 99.1 |
| Total Euro Zone | 102.8 | 103.6 | 102.6 | -0.81 | 0.20 | 102.1 | 100.2 | 99.9 |
| New Orders (2000=100) | ||||||||
| France | 107.4 | 109.7 | 104.7 | -2.10 | 2.58 | 111.6 | 100.7 | 99.3 |
| Italy | 102.0 | 103.1 | 99.8 | -1.07 | 2.20 | 99.0 | 95.5 | 99.1 |
| Germany | 116.6 | 113.9 | 106.1 | 2.37 | 9.90 | 104.8 . | 99.0 | 98.3 |
More Economy in Brief
 Global| Feb 05 2026
Charts of the Week: Balanced Policy, Resilient Data and AI Narratives
by:Andrew Cates


