 Global| Oct 02 2007
Profitability of all Nonfinancial UK Corporations: A Record High in the Second Quarter
Summary
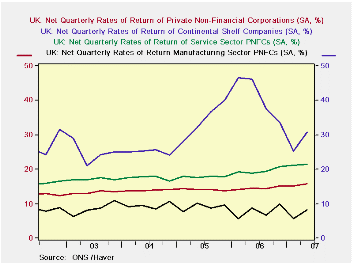
Corporate profitability in the United Kingdom continued to rise in the second quarter of this year. The net rate of return for all private nonfinancial corporations was a record 15.7%, up from 15.1% in the first quarter. (The net rate [...]

Corporate profitability in the United Kingdom continued to rise in the second quarter of this year. The net rate of return for all private nonfinancial corporations was a record 15.7%, up from 15.1% in the first quarter. (The net rate of return is defined as the ratio of net operating surplus to net capital employed.) The first chart shows the net rates of return for all private nonfinancial corporations, and for the continental shelf companies and those engaged in the manufacturing and service industries. The continental shelf companies are those engaged in the exploration for and production of oil and natural gas in the UK continental shelf. The continental shelf companies have the highest rates of return, next are those of the service companies and lowest and most volatile are those of the manufacturing companies.
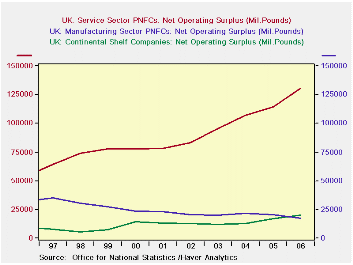
In terms of profits, the service companies rank the highest. Since not all of the underlying data are available on a quarterly basis but are on an annual basis, the latter can be used to get some idea of the relative importance of each sector in the economy. In 2006, total net operating surplus amounted to 171.2 billion pounds. Of this total, the continental shelf companies accounted for about 12% and the non continental shelf companies, 88%. The service sector accounted for 76% and the manufacturing sector, 10%. The 2% discrepancy is due to the fact that the noncontinental shelf total includes data on companies in construction, electricity and gas supply, agricultural, mining and quarrying that are not shown separately.
The manufacturing sector has steadily been losing ground to the service sector and for the first time its net operating profit was below that of the continental shelf companies in 2006, as can be seen in the second chart.
Data on the profitability of UK corporations can be found in the National Accounts section of Haver's UK data base.
| UK PROFITABILITY NET RATES OF RETURNS (Percent) | Q2 07 | Q1 07 | Q4 06 | Q3 06 | 2006 | 2005 | 2004 | 2003 |
|---|---|---|---|---|---|---|---|---|
| All Nonfinancial Corps. | 15.7 | 15.1 | 15.2 | 14.4 | 14.6 | 14.1 | 13.9 | 13.3 |
| Continental Shelf Corps. | 30.7 | 25.3 | 33.7 | 37.6 | 41.0 | 34.2 | 25.1 | 24.9 |
| Non Continental Shelf Corps. | 15.1 | 14.7 | 14.4 | 13.4 | 13.4 | 13.2 | 13.4 | 12.7 |
| Service Corps. | 21.4 | 21.2 | 20.8 | 19.4 | 19.6 | 17.9 | 17.5 | 17.2 |
| Manufacturing Corps. | 8.4 | 5.6 | 10.0 | 6.7 | 7.8 | 9.1 | 9.5 | 8.5 |
More Economy in Brief
 Global| Feb 05 2026
Charts of the Week: Balanced Policy, Resilient Data and AI Narratives
by:Andrew Cates


