 Global| Sep 21 2009
Recent Data For The Russian Economy
Summary
Preliminary data suggest that the Russian Gross Domestic Product, fell 0.5% in the second quarter, a marked improvement over the 9.0% decline in the first quarter. (These figures are based on the series that have been seasonally [...]
 Preliminary data suggest that the Russian Gross Domestic
Product, fell 0.5% in the second quarter, a marked improvement over the
9.0% decline in the first quarter. (These figures are based on the
series that have been seasonally adjusted by Haver Analytics.) August
data on production, construction, and retail sales have been
disappointing. Production and construction declined in contrast to
increases in July and retail sales showed a smaller increase in August
than in July. The unemployment rate, however, was 8.6% in August 2
basis points below July.
In spite of the July hiccup particularly in industrial
production, the prospects for increased activity in Russia have
brightened. Oil prices are up, the Reserve Bank has steadily lowered
the refinancing rate from 13% in March to 10.5% in September. Inflation, though still high, was 11.6% in August, down from 13.15% in
April. Recent data for these aspects of the Russian economy are shown
in the table below.
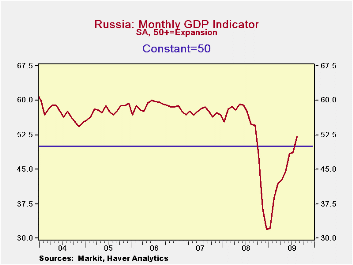
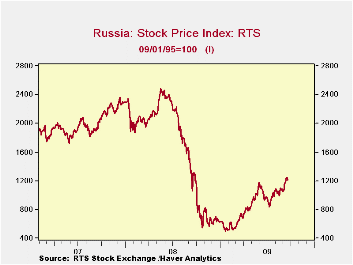
The Purchasing Mangers Survey published by Markit Economics in London reported earlier this month that the GDP indicator for Russia reached the expansion stage in August (above 50) for the first time since September, 2008 as shown in the first chart. Finally, the Stock Market has increased 44% from the recent low point reached on July10 and 1208 today is 139% above the low reached on February 2, 2009. The decline and rise in the stock market is shown in the second chart.
| RUSSIA | Sep 09 | Aug 09 | Jul 09 | Jun 09 | May 09 | Apr 09 | Mar 09 |
|---|---|---|---|---|---|---|---|
| Industrial Production (M/M % Chg) | -- | -3.0 | 4.7 | 4.5 | -2.1 | -8.1 | -- |
| Retail Sales (M/M % Chg) | -- | 1.68 | 2.36 | 0.88 | 1.70 | 0.71 | -- |
| Value of Construction Work Performed (M/M % Chg) | -- | -2.66 | 2.61 | 210.55 | 0.74 | 11.54 | -- |
| Unemployment Rate (%) | -- | 8.6 | 8.8 | 8.7 | 8.9 | 8.7 | -- |
| Inflation (%) | -- | 11.6 | 12.0 | 11.9 | 12.3 | 13.2 | -- |
| Refinancing Rate (%) | 10.50 | 10.75 | 11.00 | 11.50 | 12.00 | 12.50 | 13.00 |
| Oil Price Brent Crude (Ave of Daily Prices $ per barrel) | -- | 72.86 | 65.62 | 69.24 | 58.25 | 51.18 | -- |
More Economy in Brief
 Global| Feb 05 2026
Charts of the Week: Balanced Policy, Resilient Data and AI Narratives
by:Andrew Cates


