Global| Nov 10 2005
Record U.S. Trade Deficit Suffered Triple Whammy
by:Tom Moeller
|in:Economy in Brief
Summary
The combination of higher oil prices, higher gasoline imports and lost aircraft exports due to the Boeing strike pushed the September U.S. foreign trade deficit deeper to a record $66.1B from a little revised $59.2B in August. [...]
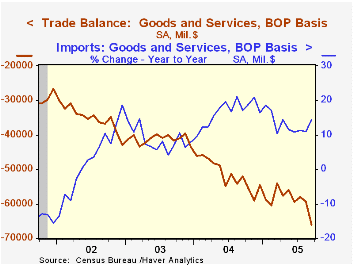
The combination of higher oil prices, higher gasoline imports and lost aircraft exports due to the Boeing strike pushed the September U.S. foreign trade deficit deeper to a record $66.1B from a little revised $59.2B in August. Consensus expectations had been for less of a deepening to $61.0B.
Imports of goods & services surged 2.4% in September. Petroleum imports jumped another 4.4% (58.7% y/y) as the per barrel price of crude petroleum rose 8.9% to $57.32 (52.8% y/y) though the value of crude oil imports fell 7.0% due to refinery shutdowns following Hurricane Katrina. Offsetting that decline, however, was a nearly one quarter surge in the value of imports of fuel oil & gasoline.
Imports of nonpetroleum goods surged 2.4% (10.1% y/y) in September as foods, feeds & beverages jumped 4.1% (17.6% y/y) and industrial supplies & materials surged 6.2% (33.0% y/y) additionally reflecting a 30.0% spike in natural gas (88.05 y/y).
Capital goods imports also rose a strong 0.9% (8.8% y/y) as imports of advanced technology products jumped 3.7% (NSA, 11.0% y/y). Imports of nonauto consumer goods jumped 2.6 (10.7% y/y) though imports of autos, parts & engines fell 3.5% (+3.7% y/y).
Total exports collapsed 2.6% due to a 7.4% drop in capital goods exports, driven by the four-week strike at Boeing Co. which caused exports of civilian aircraft to drop $2.4B or 72.3% m/m. Also, exports of advanced technology products more than reversed all of the prior month's gain with a 7.9% drop (NSA, -0.8% y/y). Finally, Gulf port closings contributed to the 5.8% m/m decline in exports of foods, feeds & beverages though these declines were dampened by a 4.1% (12.3% y/y) rise in nonauto consumer goods exports.
Services exports surged 1.6% (10.9% y/y) due to a 1.8% (13.0% y/y) jump in private travel and a 3.0% (18.1% y/y) spike in "other" private transportation services.
The US trade deficit with China deepened sharply to a record $20.1B ($161.9B in 2004) due to a 4.2% (NSA, 26.8% y/y) surge in imports that was accompanied by a 17.8% drop in exports (NSA, +11.9% y/y). The US trade deficit with Japan again improved slightly m/m to $6.4B ($75.6B in 2004) while the monthly trade deficit with the Asian NICs deepened for the fifth consecutive month to $1.5B ($21.9B in 2004). The deficit with the European Union improved slightly to $10.1B ($109.3B in 2004) due to a 1.9% (3.5% y/y) gain in exports.
| Foreign Trade | Sept | Aug | Y/Y | 2004 | 2003 | 2002 |
|---|---|---|---|---|---|---|
| Trade Deficit | $66.1B | $59.3B | $51.9B (9/04) | $617.6B | $494.8B | $421.2B |
| Exports - Goods & Services | -2.6% | 1.5% | 7.7% | 12.6% | 4.6% | -3.0% |
| Imports - Goods & Services | 2.4% | 1.8% | 14.5% | 16.6% | 8.5% | 2.1% |
by Tom Moeller November 10, 2005
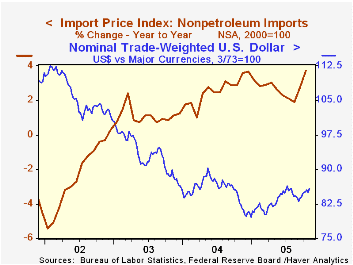
Import prices fell an expected 0.3% last month following the revised 2.3% spike in September. Petroleum prices were the source of weakness as they reversed more than half of the prior month's gain with a 4.4% drop. Crude oil prices fell 4.1% and "other" petroleum prices fell 14.4% but those decline were offset by a 20.9% (114.1% y/y) increase in natural gas.
Excluding petroleum, prices were strong for the second consecutive month and rose 0.8%. The gain reflected a 4.4% (16.1% y/y) rise in non-oil industrial supplies which repeated the gain in September. Elsewhere, paper prices rose 1.0% (3.8% y/y) and chemical prices jumped 2.1% (11.7% y/y). On the weak side, nonauto consumer goods prices fell 0.1% (+1.2% y/y) and capital goods prices slipped 0.3% (-0.5% y/y). Excluding another decline in computer prices, capital goods prices fell 0.1% (2.0% y/y).
During the last ten years there has been a 66% (negative) correlation between the nominal trade-weighted exchange value of the US dollar vs. major currencies and the y/y change in non oil import prices. The correlation is a lower 47% against a broader basket of currencies and a lower 57% against the real value of the dollar.
Export prices jumped 0.6% as nonagricultural prices rose 0.6% (3.5% y/y).
Time-Varying Pass-Through from Import Prices to Consumer Prices: Evidence from an Event Study with Real-Time Data from the Federal Reserve Bank of New York is available here.
| Import/Export Prices (NSA) | Oct | Sept | Y/Y | 2004 | 2003 | 2002 |
|---|---|---|---|---|---|---|
| Import - All Commodities | -0.3% | 2.3% | 8.1% | 5.6% | 2.9% | -2.5% |
| Petroleum | -4.4% | 8.0% | 30.9% | 30.5% | 21.0% | 3.0% |
| Non-petroleum | 0.8% | 1.0% | 3.7% | 2.6% | 1.1% | -2.4% |
| Export - All Commodities | 0.6% | 0.8% | 3.6% | 3.9% | 1.6% | -1.0% |
by Tom Moeller November 10, 2005
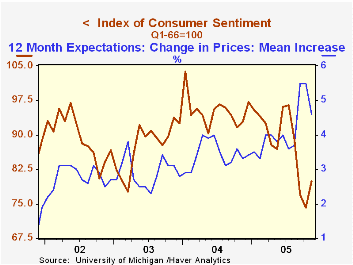
The preliminary reading of consumer sentiment in November from the University of Michigan rose 7.7% to 79.9, the highest level in three months. Consensus expectations had been for less of an improvement to 76.8.
During the last ten years there has been a 78% correlation between the level of consumer sentiment and the y/y change in real consumer spending.
The mean expected inflation rate for the next twelve months fell sharply to 4.6 from 5.5% expected in October. That prompted Consumer expectations to rise 5.7% and expected business conditions during the next year to surge 14.7%.
The current conditions index also improved 10.0% m/m (-4.2% y/y) due to 10% gains in personal finances and in buying conditions for large household goods.
The University of Michigan survey is not seasonally adjusted.The mid-month survey is based on telephone interviews with 250 households nationwide on personal finances and business and buying conditions. The survey is expanded to a total of 500 interviews at month end.
| University of Michigan | Nov | Oct | Y/Y | 2004 | 2003 | 2002 |
|---|---|---|---|---|---|---|
| Consumer Sentiment | 79.9 | 74.2 | -13.9% | 95.2 | 87.6 | 89.6 |
| Current Conditions | 100.3 | 91.2 | -4.2% | 105.6 | 97.2 | 97.5 |
| Expectations | 66.8 | 63.2 | -21.6% | 88.5 | 81.4 | 84.6 |
by Tom Moeller November 10, 2005
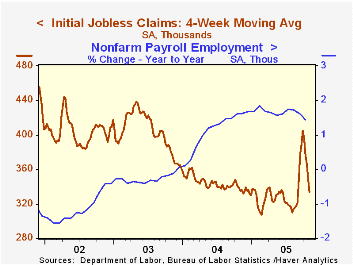
A 2,000 increase in initial claims for unemployment insurance to 326,000 reversed only a piece of the prior week's revised 6,000 decline. Consensus expectations had been for 323,000 claims.
The four-week moving average of initial claims fell sharply to 334,250 (-0.3% y/y).
Continuing claims for unemployment insurance rose 23,000 following a downwardly revised 72,000 drop during the prior week.
The insured rate of unemployment remained at 2.2% for the seventh week.
| Unemployment Insurance (000s) | 11/05/05 | 10/29/05 | Y/Y | 2004 | 2003 | 2002 |
|---|---|---|---|---|---|---|
| Initial Claims | 326 | 324 | -1.5% | 343 | 402 | 404 |
| Continuing Claims | -- | 2,818 | 0.8% | 2,926 | 3,531 | 3,570 |
by Carol Stone November 10, 2005
Several countries reported CPI data today for October.A common feature of all the countries we examined was a tempering of inflation as energy prices backed off their storm-related highs of September.
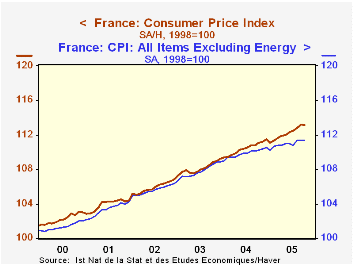
In France and Denmark, the October CPI actually declined 0.1% in the month, following 0.4% increases in both countries in September.For France, tellingly, the subset of the CPI excluding energy was flat in both months.
Ireland's total CPI rose 0.2% in October after 0.8% in September.It is seen to experience somewhat higher inflation trends overall than the others of these countries.Finally, in Norway, the total CPI was flat following September's 0.3% rise. 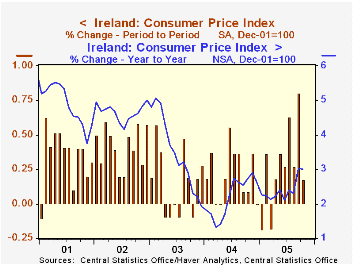
Clearly, one month need not mark a turning point in inflation trends. But this is welcome relief however long it lasts.We have noted all along how relatively immune other prices have been to the energy situation.This agreeable circumstance may yet change, given the squeeze on business operating margins that has already taken place from the surge in energy.Demand responses could well limit the ultimate pass-through, though, as sluggish economies in Europe also have little capacity to shoulder further price burdens.
As a footnote, the individual months' figures we quote here are seasonally adjusted data found in Haver's G10 database.This database is a summary compilation of major data in major countries, the well-known G10, plus Australia, Austria, other Nordic nations, Ireland, Spain and so on.In that database Haver performs some additional seasonal adjustment of data beyond that provided by many countries.The more comprehensive databases covering individual countries consist largely in data provided by the countries' official statistics sources, which we do not augment, while G10 is a database we compile ourselves for the convenience of having a quick summary of large countries, but with a modest amount of detail.
| CPI, % Changes, SA* | Oct 2005 | Sept 2005 | Aug 2005 | Oct 2004** | December/December|||
|---|---|---|---|---|---|---|---|
| 2004 | 2003 | 2002 | |||||
| France | -0.1 | 0.4 | 0.3 | 1.8 | 2.1 | 2.2 | 2.3 |
| Ex Energy | 0.0 | 0.0 | 0.5 | 1.0 | 1.5 | 2.4 | 2.1 |
| Ireland | 0.2 | 0.8 | 0.3 | 3.0 | 2.6 | 1.9 | 5.0 |
| Denmark | -0.1 | 0.4 | 0.2 | 2.0 | 1.2 | 1.4 | 2.5 |
| Norway | 0.0 | 0.3 | 0.5 | 1.8 | 1.1 | 0.6 | 2.8 |

Tom Moeller
AuthorMore in Author Profile »Prior to joining Haver Analytics in 2000, Mr. Moeller worked as the Economist at Chancellor Capital Management from 1985 to 1999. There, he developed comprehensive economic forecasts and interpreted economic data for equity and fixed income portfolio managers. Also at Chancellor, Mr. Moeller worked as an equity analyst and was responsible for researching and rating companies in the economically sensitive automobile and housing industries for investment in Chancellor’s equity portfolio. Prior to joining Chancellor, Mr. Moeller was an Economist at Citibank from 1979 to 1984. He also analyzed pricing behavior in the metals industry for the Council on Wage and Price Stability in Washington, D.C. In 1999, Mr. Moeller received the award for most accurate forecast from the Forecasters' Club of New York. From 1990 to 1992 he was President of the New York Association for Business Economists. Mr. Moeller earned an M.B.A. in Finance from Fordham University, where he graduated in 1987. He holds a Bachelor of Arts in Economics from George Washington University.
More Economy in Brief
 Global| Feb 05 2026
Charts of the Week: Balanced Policy, Resilient Data and AI Narratives
by:Andrew Cates