 Global| Aug 05 2008
Retail Trade in the Euro Area and the European Union
Summary
The indexes of retail trade in the Euro Area and the European Union, exclude the sales of motor vehicles and motor cycles. There are two indexes of total retail sales: one includes repairs of personal and household repairs and the [...]

The indexes of retail trade in the Euro Area and the European
Union, exclude the sales of motor vehicles and motor cycles. There are
two indexes of total retail sales: one includes repairs of personal and
household repairs and the other excludes them. The most quoted index
excludes the repairs.
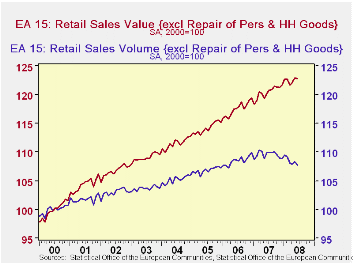
The index of value of retail trade, excluding repairs, in the Euro Area declined by a mere 0.06% in June from May, but the volume declined by 0.6%. Although the value of retail sales increased 1.4% from June of 2007 to June of 2008, the volume declined by 3.1%. Over this period, sales of food declined by 4.4% and sales of non food items, by 2.2%.The value and volume of retail trade in the Euro Area are shown in the first chart.
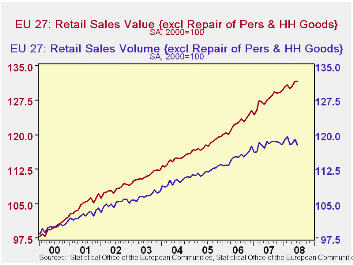
As some of the Non Euro Area countries in the European Union, particularly those in eastern Europe, chalked up substantial year over year increases in the volume of retail trade, the decline in the volume of sales over the last year was less than that for the European Union-- -1.1% vs.-3.1%. Among these, Romania showed a whopping 23.3% increase in the volume of retail sales, while Slovenia, Poland and the Czech Republic showed more moderate increases of 5.7%, 5.2% and 5.1%, respectively. The value of retail trade in the entire European Union was unchanged from May to June while the volume was down 1.1%. The value and volume of retail trade in the European Union are shown in the second chart.
| EURO AREA (15) EU (27) (2000=100) | Jun 08 | May 08 | Jun 07 | M/M % chg |
Y/Y % chg |
2007 | 2006 | 2005 |
|---|---|---|---|---|---|---|---|---|
| EURO AREA | ||||||||
| Volume of Retail Sales ex Repairs (NSA) | 104.9 | 106.7 | 108.24 | -- | -3.1 | 109.5 | 108.5 | 106.8 |
| Volume of Retail Sales ex Repairs (SA) | 107.8 | 108.4 | 109.9 | -0.6 | -- | 109.5 | 108.5 | 106.8 |
| Value of Retail Sales ex Repairs (NSA) | 120.7 | 121.9 | 119.1 | -- | 1.4 | 120.4 | 117.5 | 114.2 |
| Value of Retail Sales ex Repairs (NSA) | 122.8 | 122.9 | 120.3 | -0.06 | -- | 120.4 | 117.5 | 114.2 |
| EUROPEAN UNION | ||||||||
| Volume of Retail Sales ex Repairs (NSA) | 115.1 | 116.9 | 116.3 | -- | -1.1 | 117.9 | 115.2 | 112.2 |
| Volume of Retail Sales ex Repairs (SA) | 117.8 | 119.1 | 118.6 | -1.0 | -- | 117.9 | 115.2 | 112.2 |
| Value of Retail Sales ex Repairs (NSA) | 129.4 | 130.4 | 126.3 | -- | -0.74 | 127.8 | 122.4 | 118.0 |
| Value of Retail Sales ex Repairs (NSA) | 131.6 | 131.6 | 127.6 | 0.0 | -- | 127.8 | 122.4 | 118.0 |
More Economy in Brief
 Global| Feb 05 2026
Charts of the Week: Balanced Policy, Resilient Data and AI Narratives
by:Andrew Cates


