 Global| Sep 05 2006
Retail Trade Volume in the Euro-zone and the European Union: The Gap Continues to Widen
Summary
Data on the volume of retail trade in the twelve members of the Euro-zone and the twenty-five members of the European Union are, for the most part, reported on a seasonally unadjusted basis, a working day adjusted basis, which is also [...]

Data on the volume of retail trade in the twelve members of the Euro-zone and the twenty-five members of the European Union are, for the most part, reported on a seasonally unadjusted basis, a working day adjusted basis, which is also unadjusted for seasonality, a seasonally adjusted basis, which includes the working day adjustment and an estimate of the trend. Eurostat highlights the year over year changes in the working day adjusted series and the month to month changes in the seasonally adjusted series.
Preliminary data were released today for July. In the Euro-zone, based on partial data (data for Greece, Ireland, Italy, Luxembourg and the Netherlands are not yet available*), the volume of trade was 2.5% above July, 2005 and, on a seasonally adjusted basis, 0.6% above June. 2006. Similar figures for the European Union 25 were 3.3% and 0.3%. In addition to the missing Euro-zone data, data for the Czech Republic, Cyprus, Malta and Hungary are not available**.
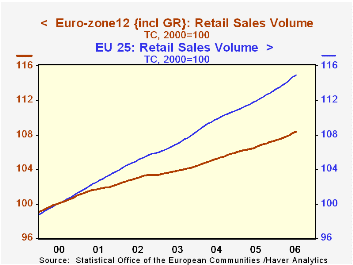
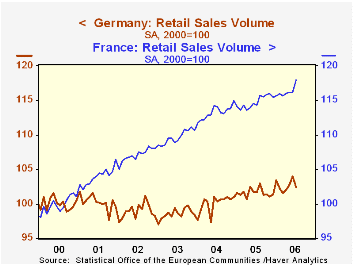
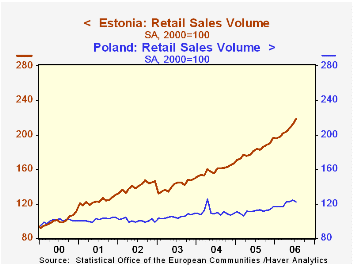
The trends of the volume of trade in the two series are shown in the first chart. The increasing gap between the two series, indicates that the growth in the volume of retail trade in the eastern European countries, the Baltic states, and Denmark, Sweden and the U. K. the European, has, on average, been greater than that of the Euro-zone countries as a whole. Growth in retail trade. however, has varied widely in both the Euro-zone and the non-Euro-zone countries in the European Union. As an example of the different growth rates in the Euro-zone, the second chart compares, the volume of retail trade in France and Germany. In July, 2006, the volume of retail trade in Germany was only 2.4% above the volume in 2000, while the volume in France was 18.0% above the 2000 volume. As an example of the different growth rates in the non Euro-zone countries, the third chart compares the volume of trade in Poland and in Estonia. Although Poland's growth in retail trade is low when compared to that of Estonia, it is within the range of that of France which is one of the faster growth countries in the Euro-zone.
| Volume of Retail Trade (2000=100) | Jul 06 | Jun 06 | Jul 05 | M/M Dif | Y/Y Dif | 2005 | 2004 | 2003 |
|---|---|---|---|---|---|---|---|---|
| France | 118.0 | 116.2 | 114.3 | 1.55 | 3.24 | 114.7 | 113.2 | 109.7 |
| Germany | 102.4 | 104.0 | 101.6 | -1.54 | 0.79 | 101.6 | 100.1 | 98.5 |
| Estonia | 218.5 | 211.9 | 183.4 | 3.11 | 19.14 | 181.84 | 158.98 | 141.34 |
| Poland | 122.2 | 124.3 | 112.1 | -1.69 | 9.01 | 111.59 | 110.24 | 105.14 |
| Euro-zone | 108.8 | 108.1 | 106. | 0.65 | 2.64 | 106.58 | 105.21 | 103.73 |
| European Union | 115.1 | 114.5 | 111.5 | 0.26 | 3.23 | 111.91 | 109.84 | 106.83 |


