 Global| Apr 14 2008
Rice Statistics in Haver Databases
Summary
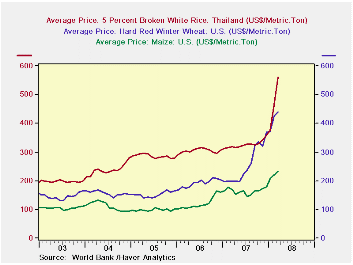
Rice is the latest grain to hit the headlines. Prices of corn, wheat and rice are shown in the first chart. The rise in the price of rice is due in part to increasing consumption and in part to the recent, exceptionally cold winter in [...]

Rice is the latest grain to hit the headlines. Prices of corn,
wheat and rice are shown in the first chart. The rise in the price of
rice is due in part to increasing consumption and in part to the
recent, exceptionally cold winter in China and other parts of Asia.
With rice the mainstay of half the world's population, its recent increase in price is causing riots in Asia, Africa and South America. The rise in price is leading to a reduction in import tariffs among those countries desperate for increased supplies of rice and the imposition of export taxes in those rice producing countries anxious to assure supplies for their own citizens. It is also responsible for a reduction in European and U. S. agricultural subsidies since the subsidies vary inversely with world prices.
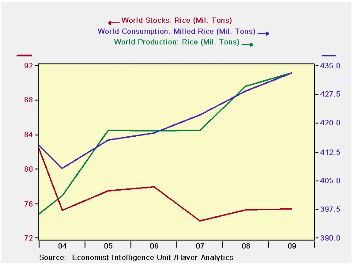
Haver Analytics has a number of data bases where the prices, production, consumption and stocks of rice may be found. In USECON, the series PRFRICE, gives the monthly dollar price of a hundred weight of rice received by U. S. farmers. The data base, WBPRICES, gives the monthly and annual data for the dollar value of a metric ton of rice. (The first chart shows these data for rice, wheat and corn.) The IFS data base also reports a dollar value of a metric ton of rice, but this series lags the World Bank series. One can compute the export price of rice from Vietnam by dividing the value of rice exports (N528IXI)@EMERGEPR by the volume (N528IJR@EMERGEPR). The Market Indicators and Forecasts of the Economist Intelligence Unit (EIU DATA BASE) have quarterly and annual data on the price of rice and annual data on production, consumption and stocks of rice as shown in the second chart.
| RICE | Mar 08 | Feb 08 | Mar 07 | M/M Chg | Y/Y Chg | 2007 | 2006 | 2005 |
|---|---|---|---|---|---|---|---|---|
| World Bank Price ($ per metric ton) | 561.8 | 464.8 | 318.7 | 20.87 | 76.28 | 326.4 | 304.9 | 286.3 |
| Price of Rice Exports in
Vietnam * ($ per metric ton) |
440.0 | 395.0 | 322.2 | 11.39 | 36.55 | 321.4 | 272.7 | n.a. |
| Price Received by Farmers in U.
S. ($ per cwt) |
12.90 | 12.50 | 10.00 | 3.20 | 29.00 | 10.26 | 8.65 | 7.02 |
| Feb 08 | Jan 08 | Feb 07 | M/M Chg | Y/Y Chg | 2007 | 2006 | 2005 | |
| IFS Price ($ per metric ton) | 481.14 | 393.48 | 316.05 | 22.28 | 52.24 | 332.29 | 303.51 | 282.81 |
| * Computed | ||||||||
| n.a. not available | ||||||||
More Economy in Brief
 Global| Feb 05 2026
Charts of the Week: Balanced Policy, Resilient Data and AI Narratives
by:Andrew Cates


