 Global| Jun 12 2007
Rises in the Japanese Corporate Goods Prices Index (CGPI) Are Yet to Be Reflected in the CPI
Summary
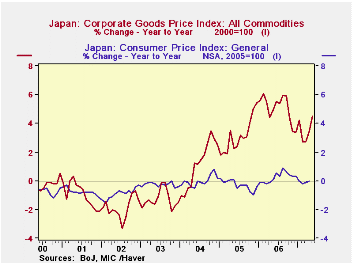
The Japanese Corporate Goods Prices Index (CGPI), a measure of producers' prices, rose 4.5% in May from May, 2006. This was the 37th month of year to year increases in this index. So far this rise has had little effect on the Consumer [...]

The Japanese Corporate Goods Prices Index (CGPI), a measure of producers' prices, rose 4.5% in May from May, 2006. This was the 37th month of year to year increases in this index. So far this rise has had little effect on the Consumer Price Index (CPI). From May, 2004 when the CGPI began its year over year rises until April* of this year, the index has risen by almost 11%. In contrast, the changes in the CPI have ranged between plus and minus 1% and have resulted in a decline of 0.1% over the whole period. The year to year changes in the CGPI and the CPI are shown in the first chart.
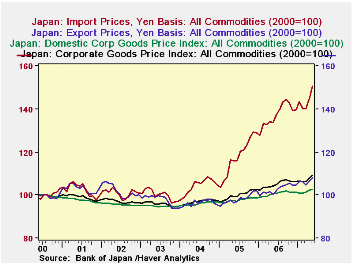
Import prices have been the chief culprit in the rise of the CGPI as can be seen in the second chart that shows the indexes for the total index and the domestic, export and import goods components.
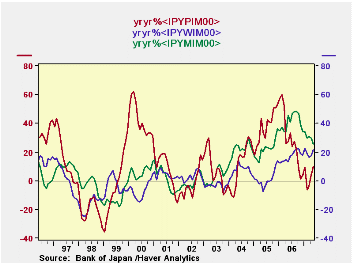
The prices of imported Metals and related products, Wood, lumber and related products and Petroleum, coal and natural gas have largely accounted for the increases in the import component of the index as can be seen in the third chart. The year over year change in the price of Petroleum, coal, and natural gas has actually shown some declines this year. But these declines have been offset by big year over year increases in the prices of Wood, lumber and related products and Metals and related products as can be seen in the third chart and in the table below.
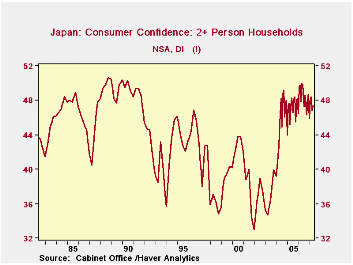
When and to what extent the producer prices will be reflected in the consumer price index is largely up to the consumer. The 0.76% increase in the private household consumption was encouraging. But consumers are still cautious. The Survey of Consumer Confidence showed a small decline in the diffusion index to 47.3% in May from 47.4% in April. A value of the index below 50% indicates that the pessimists outweigh the optimists. However, over the course of the history of survey, the optimists rarely prevailed, as can be seen in the fourth chart. The current level of 47.3% is among the highest values recorded. This suggests that the consumer may be less pessimistic than the a literal interpretation of the data would warrant. *We have used April as the final month since CPI data are not available for May.
| JAPAN CGPI AND CPI | May 07 | Apr 07 | Mar 07 | Feb 07 | Jan 07 | 2006 | 2005 | 2004 |
|---|---|---|---|---|---|---|---|---|
| Y/Y % | Y/Y % | Y/Y % | Y/Y % | Y/Y % | AVG | AVG | AVG | |
| CPI (2005=1000 | 1.00 | -0.10 | -0.20 | 0.00 | 100.3 | 100. | 100.3 | |
| CGPI (2000=100) | 4.51 | 3.46 | 2.71 | 2.71 | 4.20 | 105.1 | 100.1 | 97.1 |
| Domestic Prices | 2.19 | 2.30 | 2.01 | 1.71 | 2.12 | 100.7 | 97.7 | 96.1 |
| Export Prices | 7.85 | 4.62 | 3.56 | 4.53 | 6.21 | 102.8 | 98.3 | 96.4 |
| Import Prices | 12.48 | 8.13 | 5.50 | 5.25 | 12.36 | 137.3 | 118.0 | 104.3 |
| Metals and products | 25.80 | 30.14 | 30.77 | 29.25 | 34.20 | 215.9 | 157.1 | 124.9 |
| Wood, lumber & related products | 21.55 | 17.21 | 16.41 | 18.72 | 22.66 | 132.2 | 112.8 | 111.3 |
| Petroleum, coal and natural gas | 10.16 | 3.55 | -3.77 | -6.44 | 9.36 | 216.1 | 172.0 | 124.0 |


