 Global| May 13 2008
Rising Inflation And Slowing Economy: A Dilemma For UK's Monetary Policy Committee On June 8
Summary
Rising inflation has constrained the Bank of England's monetary policy in its attempt to lower rates to stimulate the slowing economy. After cutting its policy rate from 5.75% to 5.00% on April 10, it held the rate steady on May 8, [...]

Rising inflation has constrained the Bank of England's monetary policy in its attempt to lower rates to stimulate the slowing economy. After cutting its policy rate from 5.75% to 5.00% on April 10, it held the rate steady on May 8, largely because of inflation. The next meeting of the Monetary Policy Committee will be on June 8. Since May 8, inflation has worsened and the economy continues to slow.
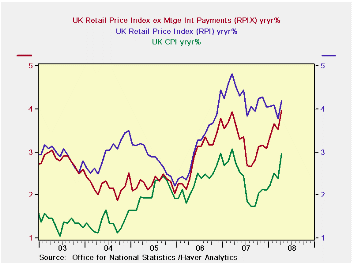
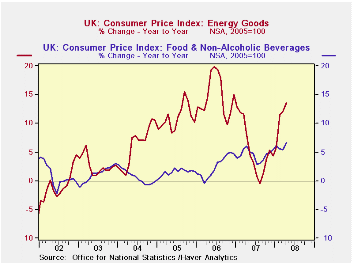
From 2.4% in March inflation in April rose to 3.0%, just within the bounds of the Bank's target (2.0% + or - 1%). The Retail Price Index (RPI), which is used in wage negotiation rose to 4.2% from 3.8% in March and the Retail Price Index excluding mortgage interest payments (RPIX) rose from 3.5% in March to 4.0%in April. The RPIX was the official inflation measure until 2003. The three inflation measures are shown in the first chart. As is the case world wide, it is food and energy costs that account for the spurt in inflation in the UK as can be seen in the second chart.
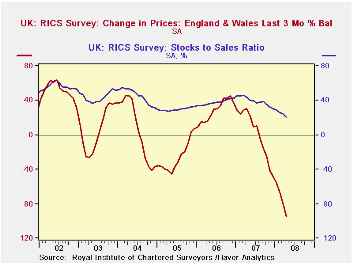
The release today of the Royal Institute of Chartered Surveyors (RICS) Housing Market Survey adds to the growing evidence of a continued slowing of the economy. The percentage of surveyors experiencing lower prices in the last three months was 95.1% greater than those experiencing higher prices. This was the largest negative balance of the entire series beginning in January, 1978. Moreover, the ratio of sales to stocks of the surveyors was also at an all time low of 21.1% as can be seen in the third chart.


| UK INFLATION | Apr 08 | Mar 08 | Feb 08 | Jan 08 | 2007 | 2006 | 2005 |
|---|---|---|---|---|---|---|---|
| Consumer Price Index (CPI) | 3.0 | 2.4 | 2.5 | 2.2 | 2.3 | 2.3 | 2.1 |
| Food | 6.6 | 5.5 | 5.6 | 6.1 | 4.5 | 2.5 | 1.5 |
| Energy | 13.6 | 12.1 | 11.4 | 5.8 | 5.4 | 14.7 | 11.0 |
| Retail Price Index (RPI) | 4.2 | 3.8 | 4.1 | 4.1 | 4.3 | 3.2 | 2.8 |
| RPI ex mtge. int. paymts (RPIX) | 4.0 | 3.5 | 3.6 | 3.4 | 3.2 | 2.9 | 2.3 |
| ROYAL INST. OF CHARTERED SURVEYORS (RICS) | |||||||
| House Price Change Last 3 Mo % balance | -95.1 | -79.4 | -66.2 | -55.0 | 1.7 | 28.3 | -25.9 |
| Ratio: Sales to Stocks % | 21.1 | 24.6 | 26.1 | 28.6 | 38.3 | 37.7 | 29.7 |
More Economy in Brief
 Global| Feb 05 2026
Charts of the Week: Balanced Policy, Resilient Data and AI Narratives
by:Andrew Cates


