 Global| Nov 27 2012
Russian Corporate Profits
Summary
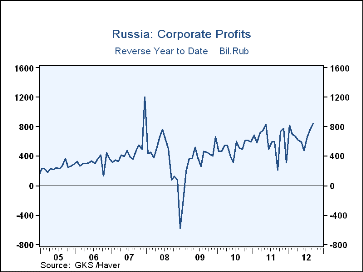
Russian corporate profits increased by 84.5 billion rubles from August to 843.4 billion rubles in September and were up 629.1 billion rubles from September, 2011. With the ruble roughly equivalent to 31 U. S. dollars, the comparable [...]
Russian corporate profits increased by 84.5 billion rubles from August to 843.4 billion rubles in September and were up 629.1 billion rubles from September, 2011. With the ruble roughly equivalent to 31 U. S. dollars, the comparable dollar figures are, respectively, $2.7 billion, $27.2 billion and $20.3 billion.
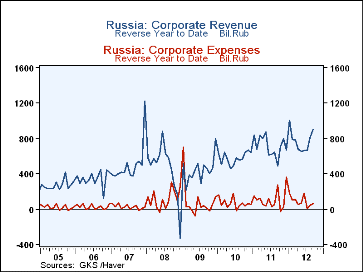
Russia reports corporate revenue, expenses and profits by industry, but no data are given on the composition of profits, such as sales, cost of goods sold, wages, depreciation, etc. Moreover, the data are reported on a year to date basis. We have used the advanced function in DLX that converts year to date data into monthly data and plotted the resulting data on corporate profits in the first chart and that on revenues and expenses in the second chart.
Russian profits have shown a slightly greater upward trend in recent years, but have also shown more volatility in the last year and a half, as can be seen in the first chart. The upward trend in profits is largely the result of more rapid recovery of revenues than that of expenses following the 2008-09 recession, as can be seen in the second chart.
| Russia (Bil. Rubles) | ||||||||
| Sep '12 | Aug '12 | Sep '11 | M/M Chg | Y/Y Chg | 2012 | 2011 | 2010 | |
| Corporate Revenue | 905.6 | 808.2 | 488.1 | 97.0 | 417.1 | 8555.6 | 6929.8 | 5356.2 |
| Corporate Expenses | 62.2 | 49.3 | 273.8 | 12.9 | -211.6 | 1302.9 | 796.9 | 1055.7 |
| Corporate Profits | 843.4 | 758.9 | 214.3 | 84.5 | 629.1 | 7252.7 | 6132.9 | 4300.5 |


