 Global| Mar 13 2012
Sentiment Among German Investor And Analyst Improves
Summary
The 285 German investors and analysts who participated in the March ZEW survey saw a slight deterioration of 2.7percentage points in their appraisal of current conditions from, an excess of optimists of 40.3% to one of 37.6%; but they [...]
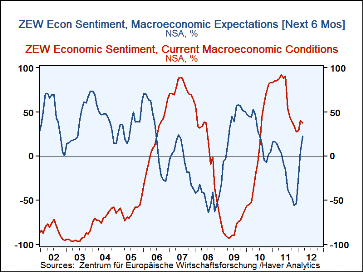
The 285 German investors and analysts who participated in the March ZEW survey saw a slight deterioration of 2.7percentage points in their appraisal of current conditions from, an excess of optimists of 40.3% to one of 37.6%; but they saw a substantial improvement--16.9 percentage points--in their appraisal of their expectations of conditions six month in the future, from an excess of optimists of 5.4% to one 22.3%. This was the fourth rise in the year and was the highest since June 2010 as can be seen in the first chart.
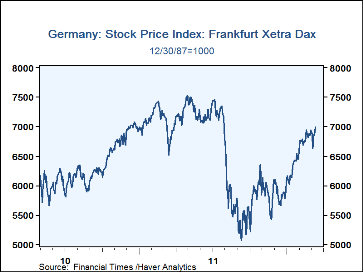
Several factors appear to have contributed to the improvement. The successful conclusion of one phase of the restructuring of Greece's debt and the subsequent release of 130 billion Euros as part of a second agreement designed to prevent a collapse of the economy and to contain the debt crisis, no doubt, was a big factor in easing tensions. In addition, employment continued to increase in January and, in spite of the global slowdown, German exports managed a small increase in January, resulting in an increase in the balance of trade. Finally, the stock market has been on a relatively steady rise since the first of the year, as can be seen in the second chart.
With a more positive outlook, the investors and analysts have raised their expectations for the profitability of many of the thirteen industries that are monitored by the ZEW Institute. Data for February and March are shown in the table below. The profitability was downgraded only in Consumption/Trade, Telecommunications and Services.
| Mar'12 | Feb'12 | Mar'11 | M/M Chg | Y/Y Chg | '11 | '10 | '09 | |
|---|---|---|---|---|---|---|---|---|
| Germany: ZEW (Percent Balance) | ||||||||
| Current Conditions | 37.6 | 40.3 | 28.4 | -2.7 | -47.8 | 67.2 | 10.3 | -80.5 |
| Economic Expectations | 22.3 | 5.4 | 14.1 | 16.9 | 8.2 | -17.2 | 24.5 | 30.0 |
| Profit Expectations | Mar'12 | Feb'12 | ||||||
| Banks | -18.2 | -34.7 | ||||||
| Insurance | -20.7 | -33.0 | ||||||
| Motor Vehicles | -5.0 | -2.1 | ||||||
| Chemicals | 21.1 | 14.8 | ||||||
| Steel | -2.1 | -11.7 | ||||||
| Electronics | 11.4 | 2.5 | ||||||
| Machinery | 8.6 | 6.7 | ||||||
| Consumption and Trade | -22.7 | 13.0 | ||||||
| Construction | 20.5 | 6.0 | ||||||
| Utilities | -14.8 | -20.7 | ||||||
| Information Tech | 22.8 | 22.2 | ||||||
| Telecommunications | -7.6 | -3.7 | ||||||
| Services | 12.4 | 17.1 | ||||||
More Economy in Brief
 Global| Feb 05 2026
Charts of the Week: Balanced Policy, Resilient Data and AI Narratives
by:Andrew Cates


